Fig. 20.
Download original image
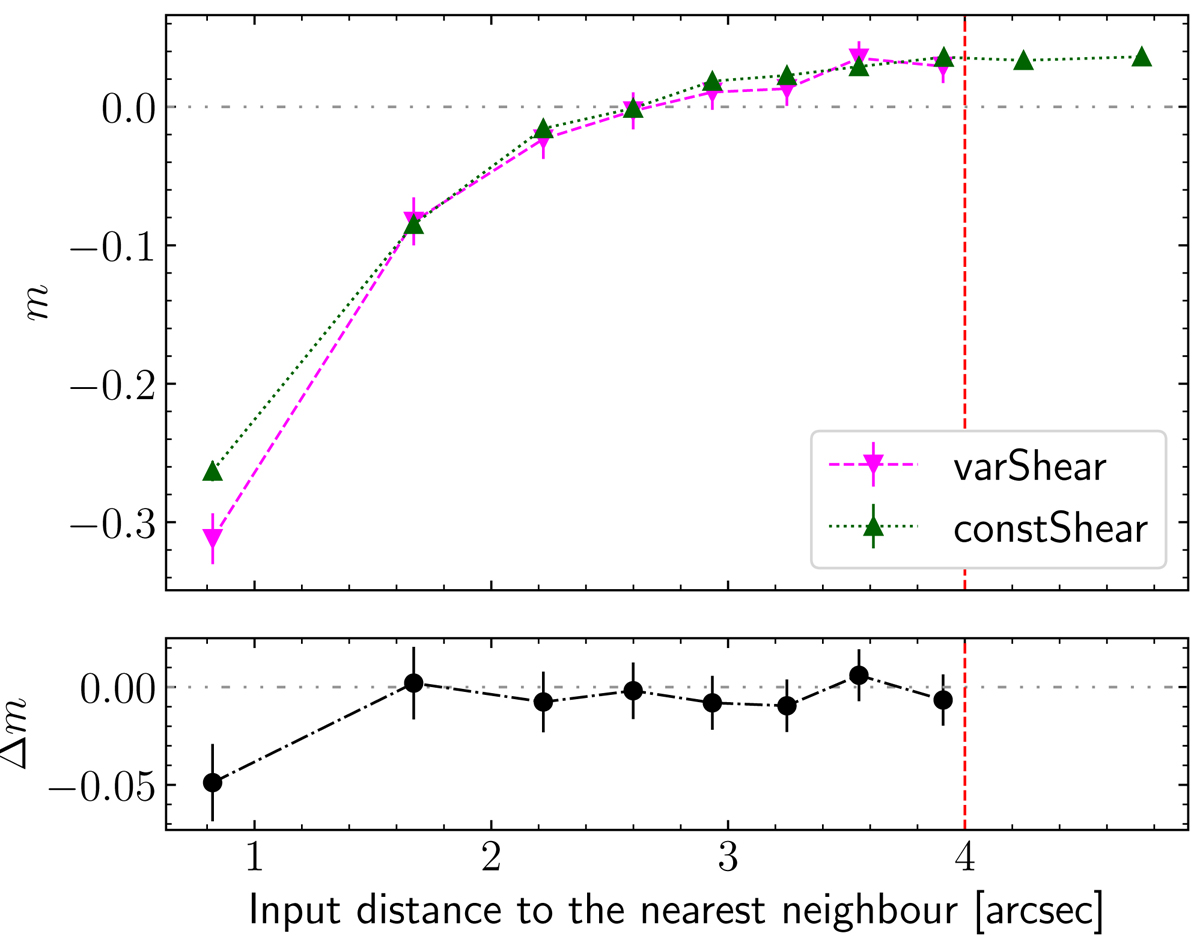
Multiplicative bias as a function of the nearest neighbour distance. The distance is measured in the input catalogue after removing faint galaxies whose r-band input magnitude > 25. The x-axis values correspond to the weighted average of each sub-sample selected to estimate the multiplicative bias shown on the y-axis. Top panel: the individual biases measured from the blending-only variable shear simulations (magenta points) and the blending-only constant shear simulations (dark green points). The vertical dashed lines show the threshold we set when building the blending-only simulations. Two extra dark green points beyond the threshold are calculated from the full constant shear simulations. Bottom panel: the difference between these two estimates (varShear – constShear).
Current usage metrics show cumulative count of Article Views (full-text article views including HTML views, PDF and ePub downloads, according to the available data) and Abstracts Views on Vision4Press platform.
Data correspond to usage on the plateform after 2015. The current usage metrics is available 48-96 hours after online publication and is updated daily on week days.
Initial download of the metrics may take a while.