Fig. 18.
Download original image
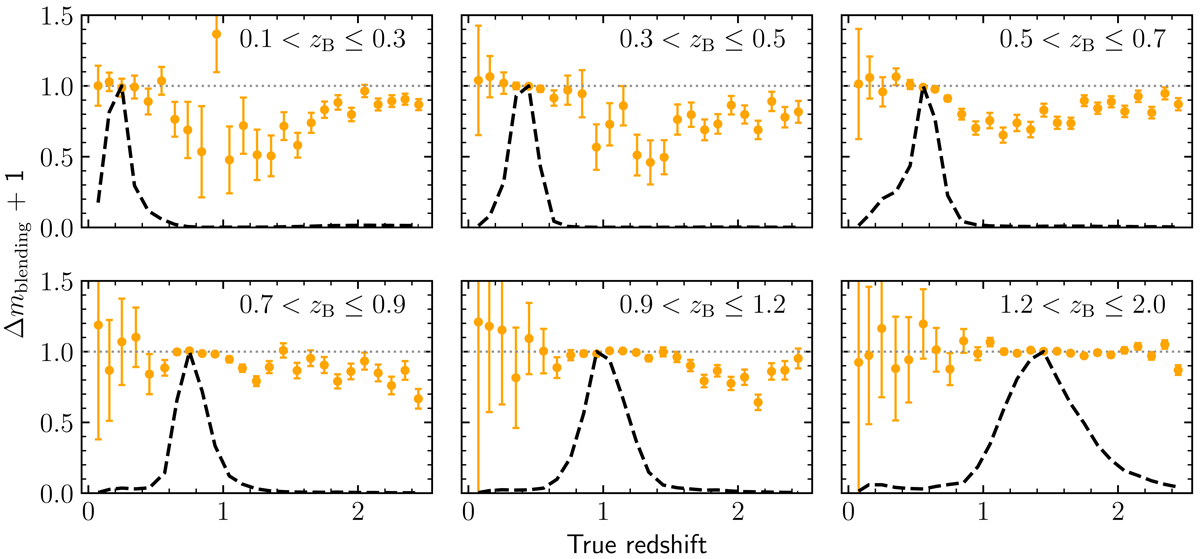
Residual shear bias introduced by the shear-interplay effect (orange points) as a function of the true redshift estimated from the blending-only simulations. The residuals are calculated from ![]() , with
, with ![]() the shear bias from the blending-only variable shear simulations and
the shear bias from the blending-only variable shear simulations and ![]() the shear bias from the blending-only constant shear simulations. The error bars correspond to the fitting uncertainties reported by the linear regression. They are driven by two factors: the number of objects used by the fitting and the amplitude of the input shear value. The dashed lines show the normalised number density with respect to redshift.
the shear bias from the blending-only constant shear simulations. The error bars correspond to the fitting uncertainties reported by the linear regression. They are driven by two factors: the number of objects used by the fitting and the amplitude of the input shear value. The dashed lines show the normalised number density with respect to redshift.
Current usage metrics show cumulative count of Article Views (full-text article views including HTML views, PDF and ePub downloads, according to the available data) and Abstracts Views on Vision4Press platform.
Data correspond to usage on the plateform after 2015. The current usage metrics is available 48-96 hours after online publication and is updated daily on week days.
Initial download of the metrics may take a while.