Fig. 16.
Download original image
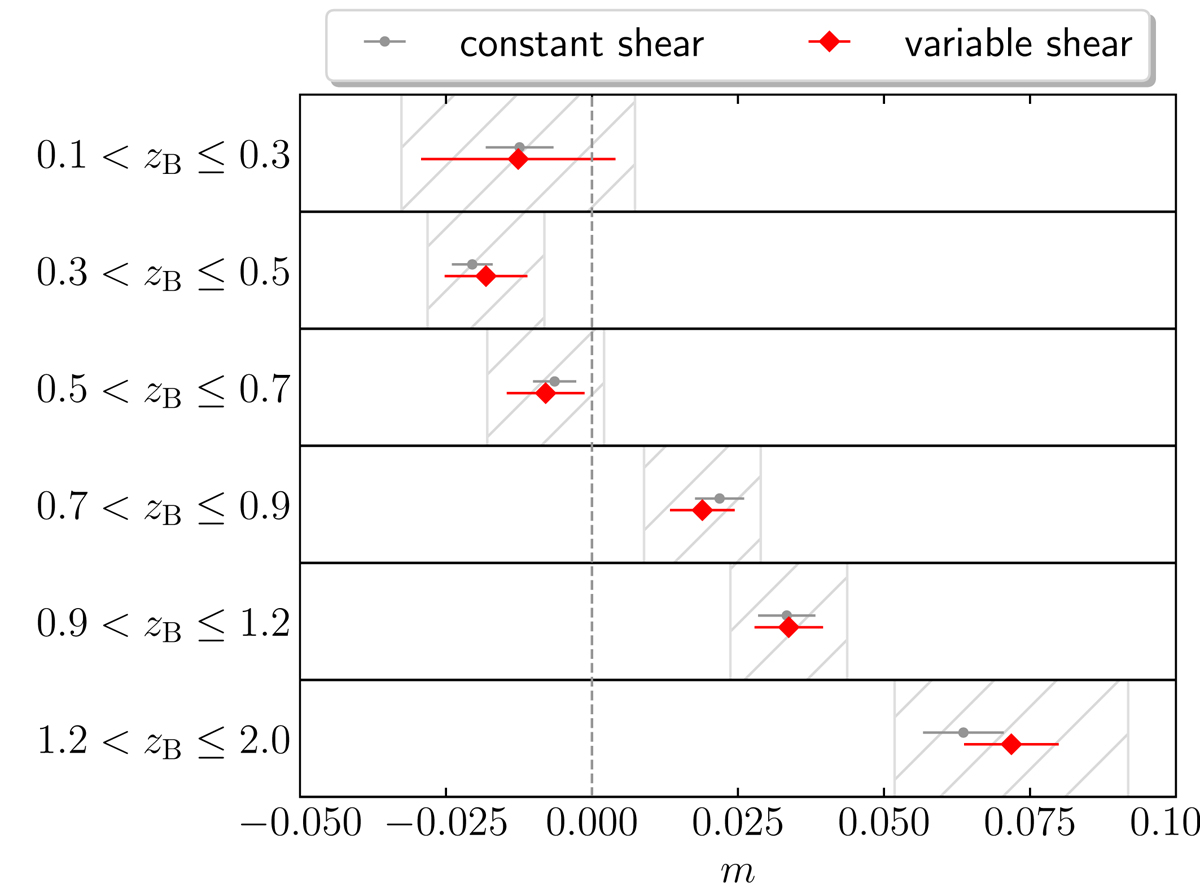
Multiplicative bias as a function of tomographic bins for KiDS-DR4 with the updated lensfit. The red diamonds indicate our final results with the corrections for the shear-interplay effect (Sect. 5.2) and PSF modelling bias (Sect. 5.3), whilst the grey points are the raw results from the idealised constant shear simulations (Sect. 5.1). The hatched regions indicate the nominal error budgets proposed for comparison (see Sect. 6 for details).
Current usage metrics show cumulative count of Article Views (full-text article views including HTML views, PDF and ePub downloads, according to the available data) and Abstracts Views on Vision4Press platform.
Data correspond to usage on the plateform after 2015. The current usage metrics is available 48-96 hours after online publication and is updated daily on week days.
Initial download of the metrics may take a while.