Open Access
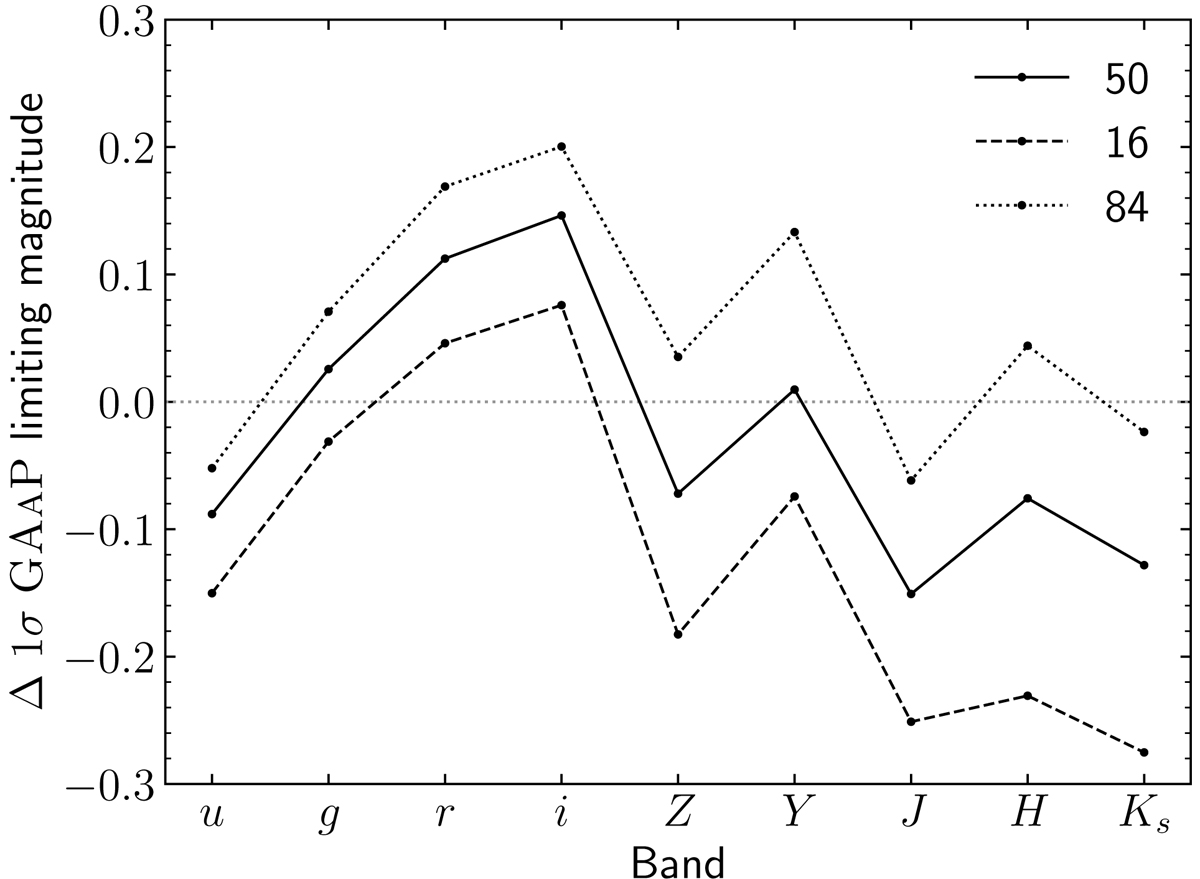
Fig. 10.
Download original image
Differences of the image’s median 1σ GAAP limiting magnitudes for the nine bands (simulation – data). The three lines indicate the 16, 50 and 84 percentiles from the 108 tiles included in the SKiLLS fiducial run. The larger scatters in the NIR bands are partially caused by the simplified simulating strategy.
Current usage metrics show cumulative count of Article Views (full-text article views including HTML views, PDF and ePub downloads, according to the available data) and Abstracts Views on Vision4Press platform.
Data correspond to usage on the plateform after 2015. The current usage metrics is available 48-96 hours after online publication and is updated daily on week days.
Initial download of the metrics may take a while.