Fig. 1.
Download original image
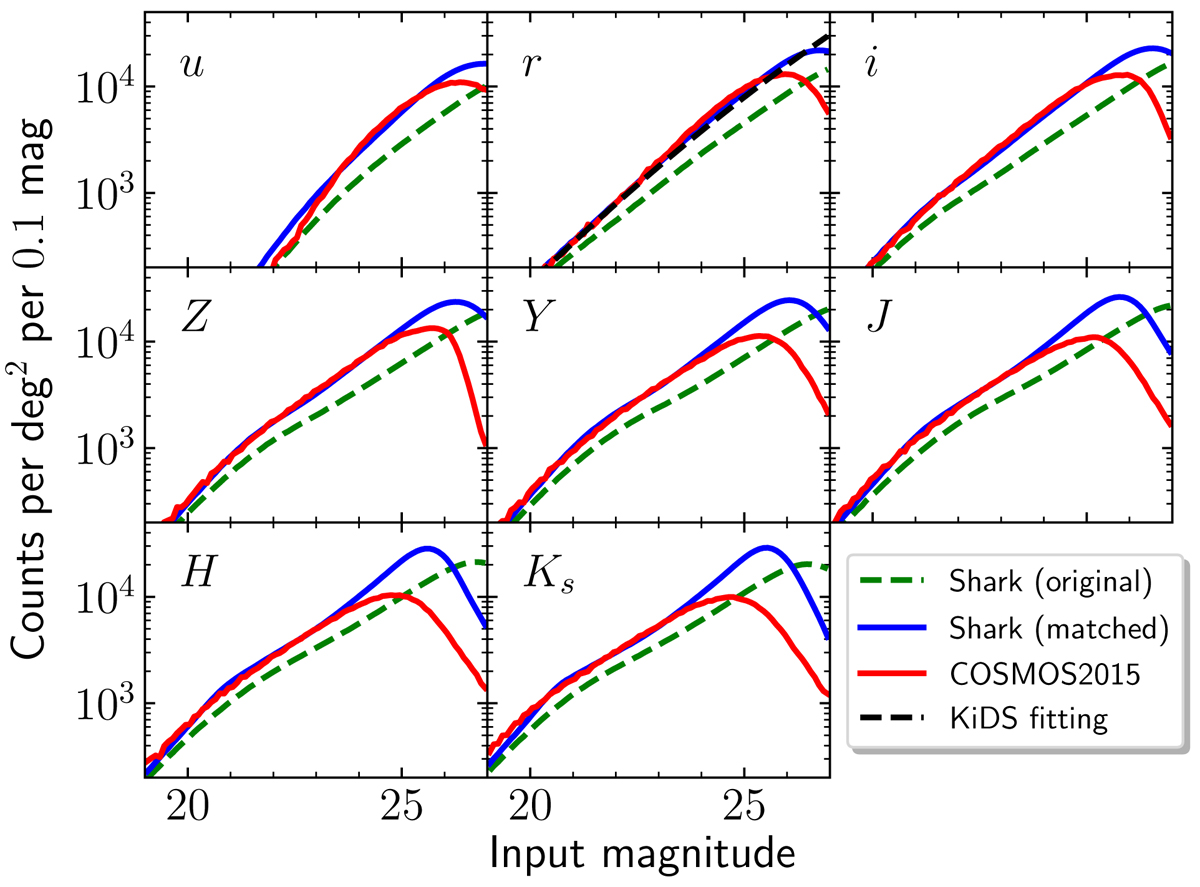
Number of galaxies per square degree per 0.1 mag in the input apparent magnitudes. The green dashed lines are from the original SURFS-SHARK mock catalogue, whilst the blue solid lines denote the modified results. The red solid lines correspond to the COSMOS2015 observations with flags applied for the UltraVISTA area inside the COSMOS field after removing saturated objects and bad areas (1.38 deg2 effective area, Table 7 of Laigle et al. 2016). The analytical fitting result in the r-band (black dashed line) is from FC17. The g-band photometry is not in the COSMOS2015 catalogue and, thus, not shown in the plot. We note that the COSMOS2015 catalogue is incomplete at Ks ≳ 24.5 (Laigle et al. 2016).
Current usage metrics show cumulative count of Article Views (full-text article views including HTML views, PDF and ePub downloads, according to the available data) and Abstracts Views on Vision4Press platform.
Data correspond to usage on the plateform after 2015. The current usage metrics is available 48-96 hours after online publication and is updated daily on week days.
Initial download of the metrics may take a while.