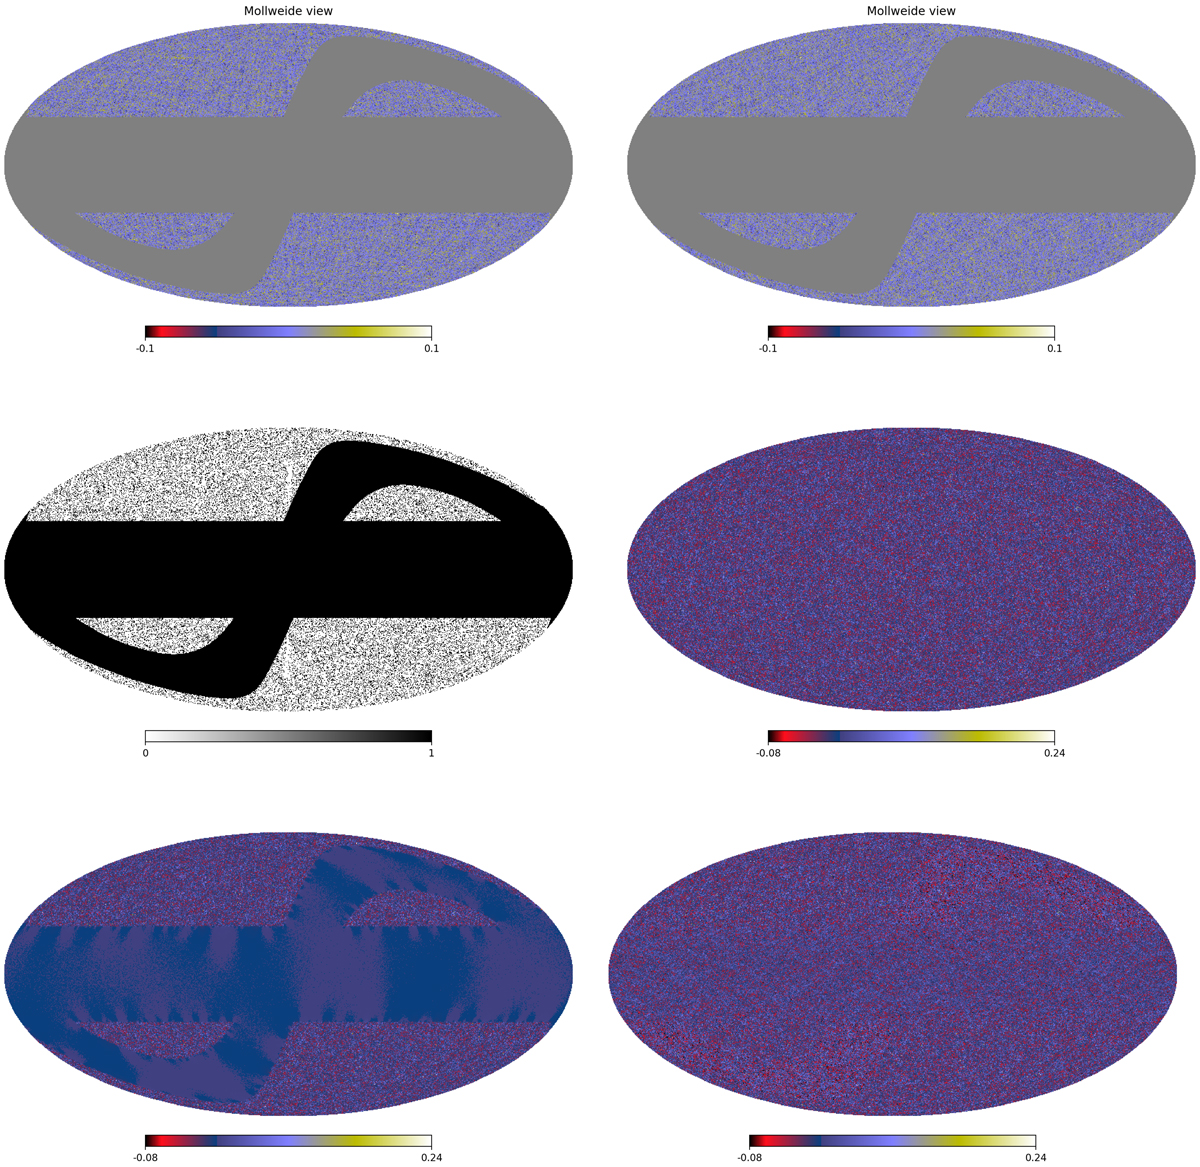
Fig. 2.
Download original image
Shear field is shown in the first and second columns of the upper panel (the first showing γ1 and the second showing γ2) with missing data. The first column of the middle panel shows the mask which applied to the shear maps and the second column shows the original E-mode convergence κ map. The lower panel shows the E-mode convergence maps reconstructed from the incomplete shear field using the SKS method (left), and using the SKS+ method (right).
Current usage metrics show cumulative count of Article Views (full-text article views including HTML views, PDF and ePub downloads, according to the available data) and Abstracts Views on Vision4Press platform.
Data correspond to usage on the plateform after 2015. The current usage metrics is available 48-96 hours after online publication and is updated daily on week days.
Initial download of the metrics may take a while.