Open Access
Fig. 4
Download original image
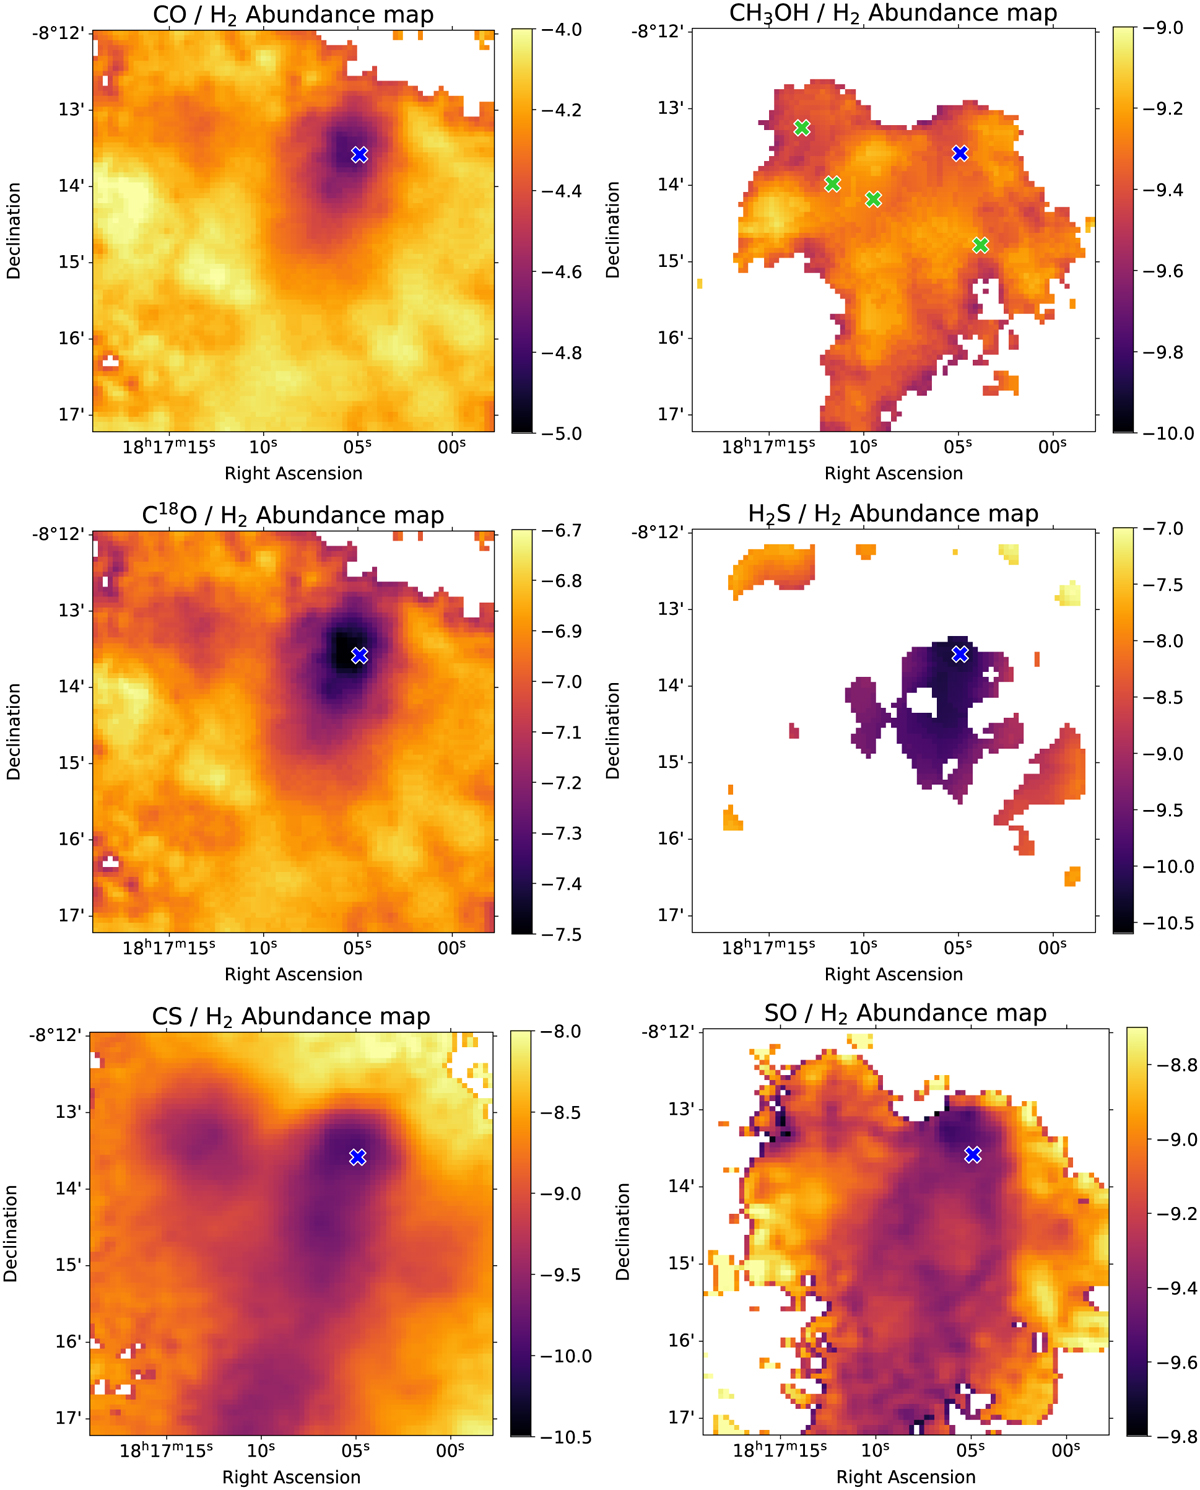
On a logarithmic scale, observed gas-phase abundance maps with respect to H2. The green crosses on the methanol map correspond to the positions of the methanol ice observations reported by Boogert et al. (2011). The dark blue cross is the continuum peak. We note that the white cross on H2S/H2 represents a gap in the data.
Current usage metrics show cumulative count of Article Views (full-text article views including HTML views, PDF and ePub downloads, according to the available data) and Abstracts Views on Vision4Press platform.
Data correspond to usage on the plateform after 2015. The current usage metrics is available 48-96 hours after online publication and is updated daily on week days.
Initial download of the metrics may take a while.