Fig. 3
Download original image
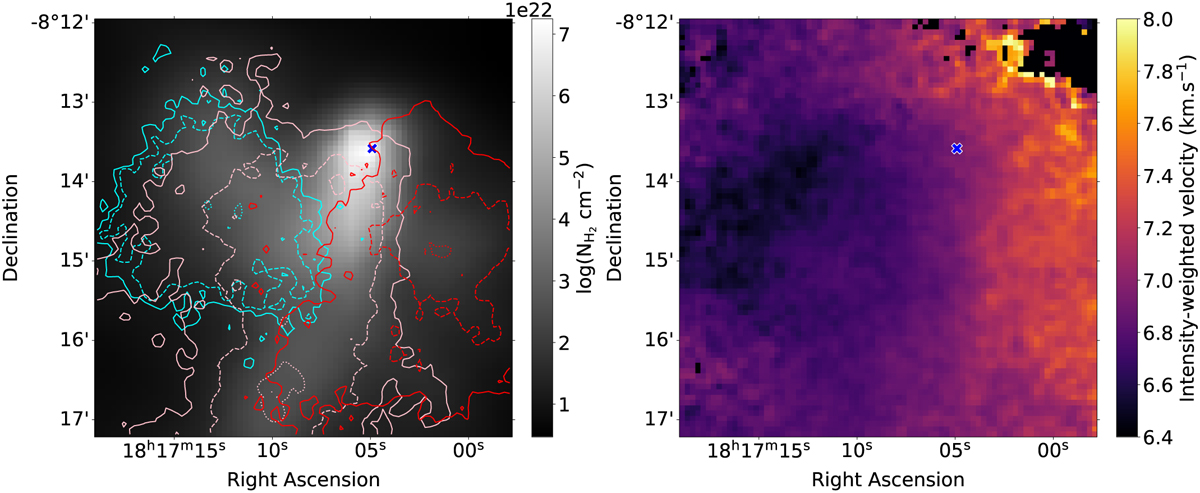
Velocity distribution in the cloud. C18O integrated intensity contours over plotted on the ![]() Herschel map (gray color). Contours are shown for the three velocity components detailed in the text (left). Cyan: 5.95–6.25 km s−1 (with intensity levels as follows: dotted is 0.4 K, dashed is 0.5 K and solid line is 1 K), pink: 6.25–7 km s−1 (with dotted as 1 K, dashed is 1.5 K and solid line is 2.4 K), red: 7–7.6 km s−1 (with dotted as 1 K, dashed as 1.5 K and solid line as 2 K). Velocity (first-moment) map (right). The dark blue cross shows the position of the continuum peak.
Herschel map (gray color). Contours are shown for the three velocity components detailed in the text (left). Cyan: 5.95–6.25 km s−1 (with intensity levels as follows: dotted is 0.4 K, dashed is 0.5 K and solid line is 1 K), pink: 6.25–7 km s−1 (with dotted as 1 K, dashed is 1.5 K and solid line is 2.4 K), red: 7–7.6 km s−1 (with dotted as 1 K, dashed as 1.5 K and solid line as 2 K). Velocity (first-moment) map (right). The dark blue cross shows the position of the continuum peak.
Current usage metrics show cumulative count of Article Views (full-text article views including HTML views, PDF and ePub downloads, according to the available data) and Abstracts Views on Vision4Press platform.
Data correspond to usage on the plateform after 2015. The current usage metrics is available 48-96 hours after online publication and is updated daily on week days.
Initial download of the metrics may take a while.