Open Access
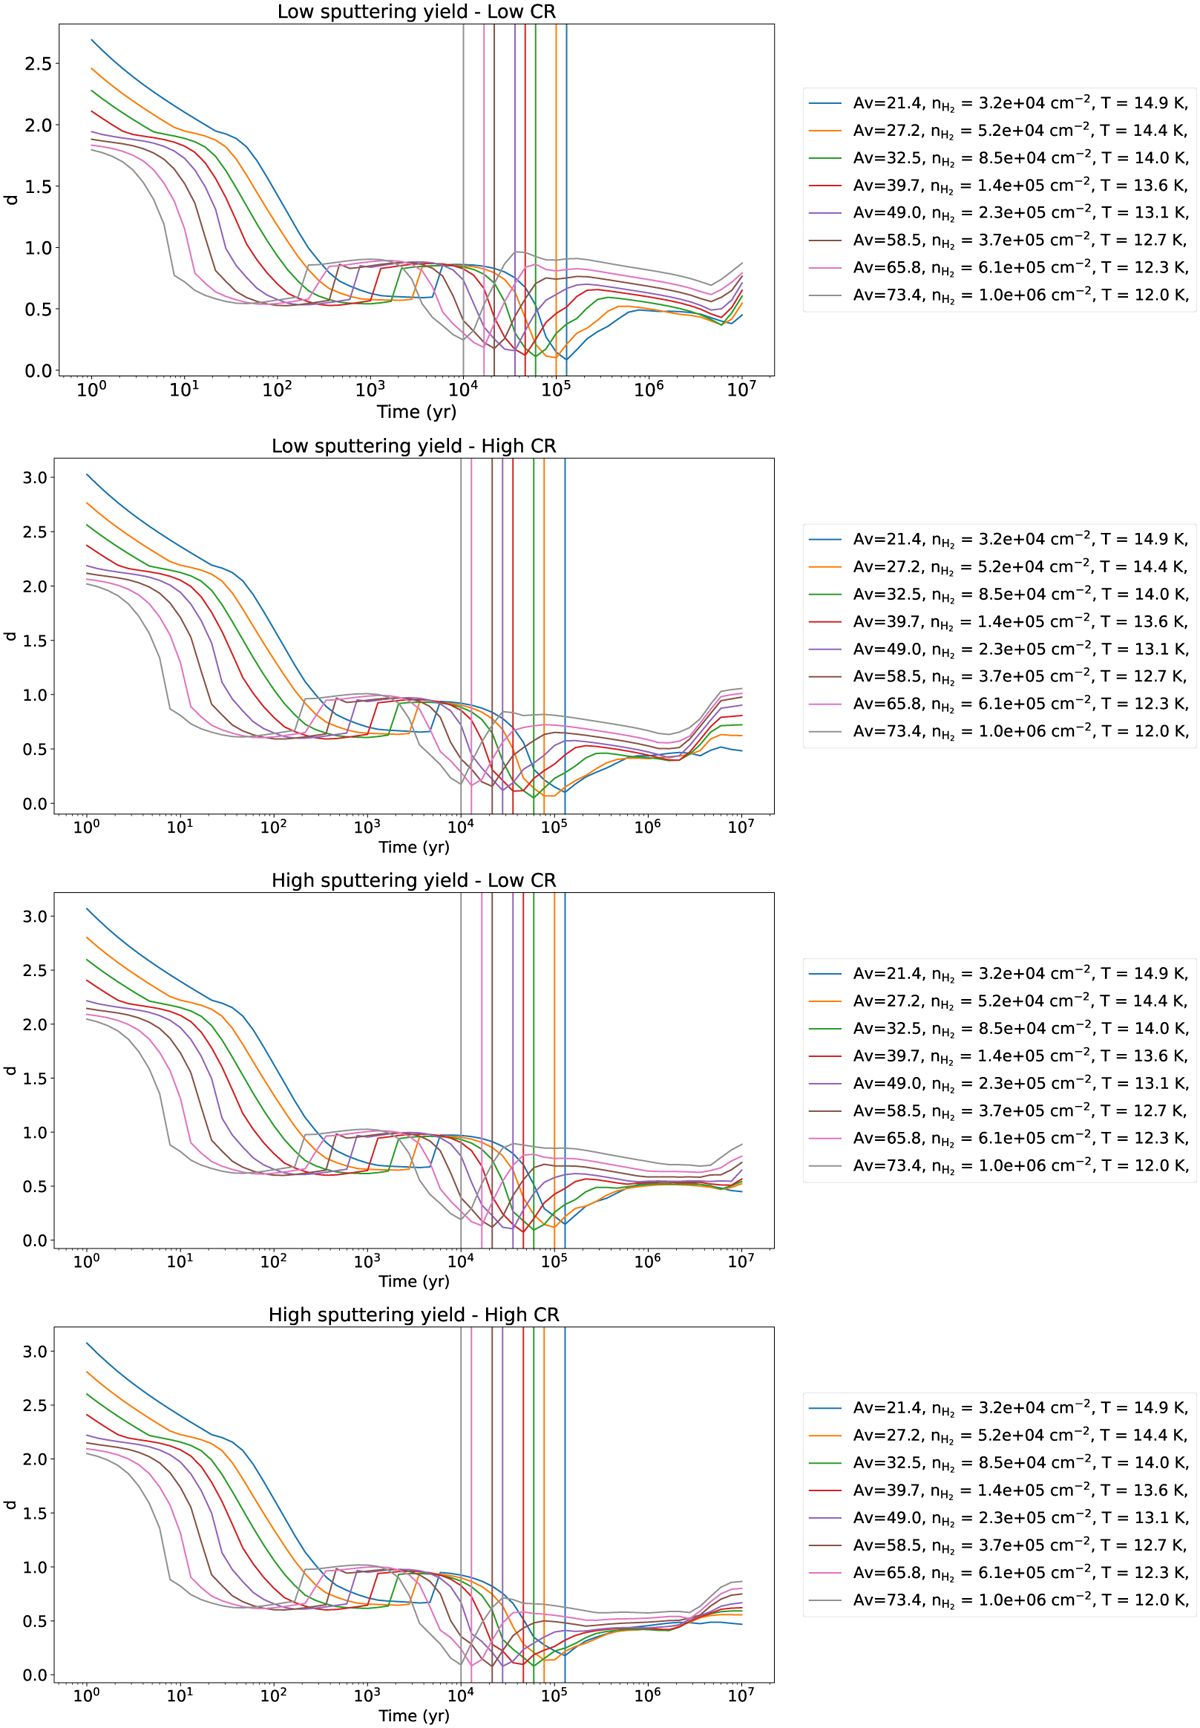
Fig. H.1
Download original image
Distance of disagreement d for all eight models as a function of time. Each figure represents the result of a set of model as defined in Table 2. The legend gives each physical parameters associated for the model shown. Each vertical line represents the lowest disagreement distance associated with each grid of parameters.
Current usage metrics show cumulative count of Article Views (full-text article views including HTML views, PDF and ePub downloads, according to the available data) and Abstracts Views on Vision4Press platform.
Data correspond to usage on the plateform after 2015. The current usage metrics is available 48-96 hours after online publication and is updated daily on week days.
Initial download of the metrics may take a while.