Open Access
Fig. D.1
Download original image
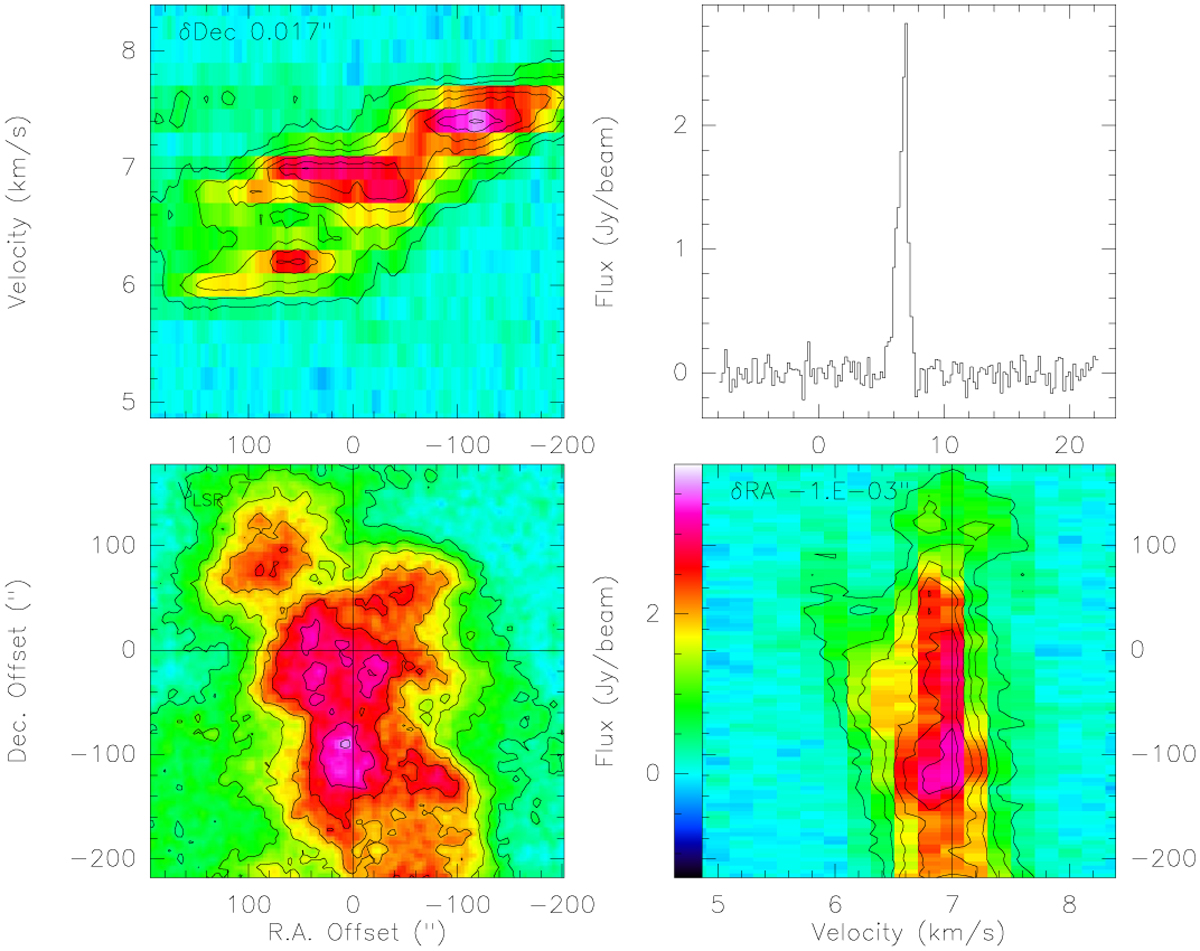
PV diagram of C18O. Bottom-left: Integrated intensity of C18O. Top-left: PV diagram obtained by integrating the velocity along the horizontal axis. Bottom-right: PV diagram obtained by integrating the velocity along the vertical axis. Top right: Spectra associated with the crossing of the two axes.
Current usage metrics show cumulative count of Article Views (full-text article views including HTML views, PDF and ePub downloads, according to the available data) and Abstracts Views on Vision4Press platform.
Data correspond to usage on the plateform after 2015. The current usage metrics is available 48-96 hours after online publication and is updated daily on week days.
Initial download of the metrics may take a while.