Fig. 10
Download original image
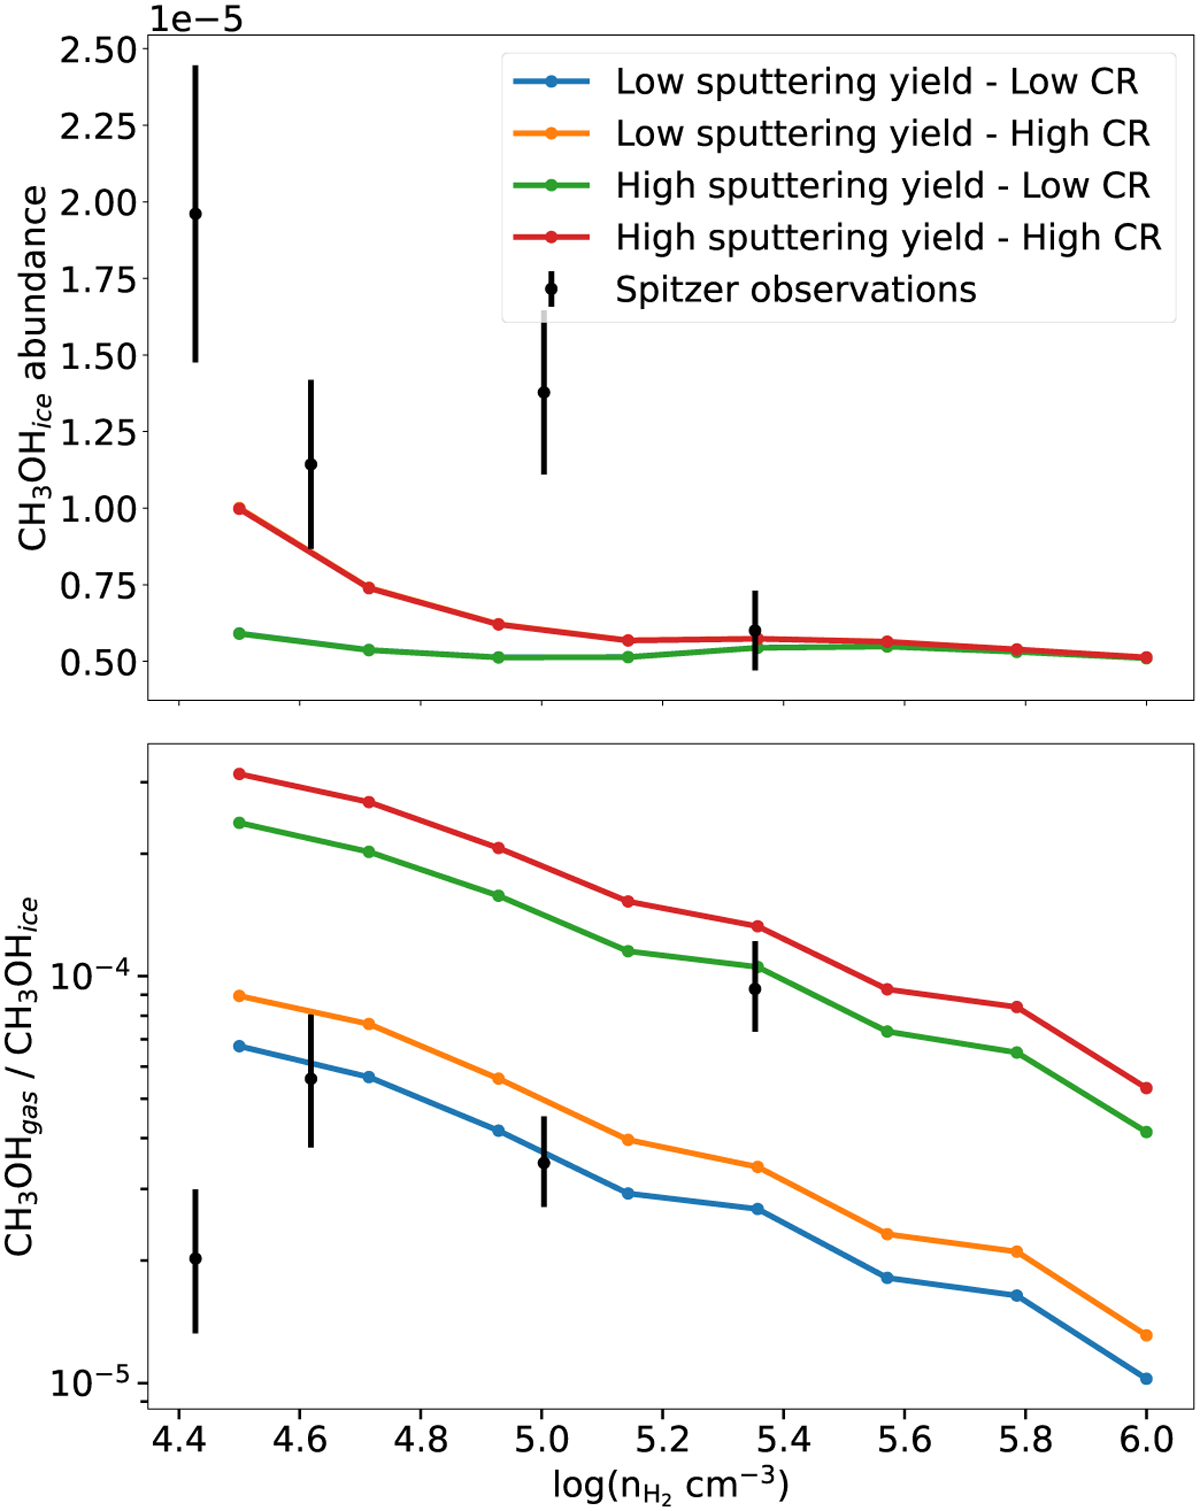
Comparison between modeled and observed methanol. Upper panel: abundance of methanol ices obtained by our chemical model as a function of density (solid lines; see text and Table 2 for details on the model sets). The black points (with uncertainties) are the observed values at the four positions probed by Boogert et al. (2011). Red and orange curves overlap as well as the green and blue curves. Lower panel: gas-to-ice abundance ratios of methanol as a function of density obtained by the different sets of models for the best times (solid lines) and the four observation points (black dots).
Current usage metrics show cumulative count of Article Views (full-text article views including HTML views, PDF and ePub downloads, according to the available data) and Abstracts Views on Vision4Press platform.
Data correspond to usage on the plateform after 2015. The current usage metrics is available 48-96 hours after online publication and is updated daily on week days.
Initial download of the metrics may take a while.