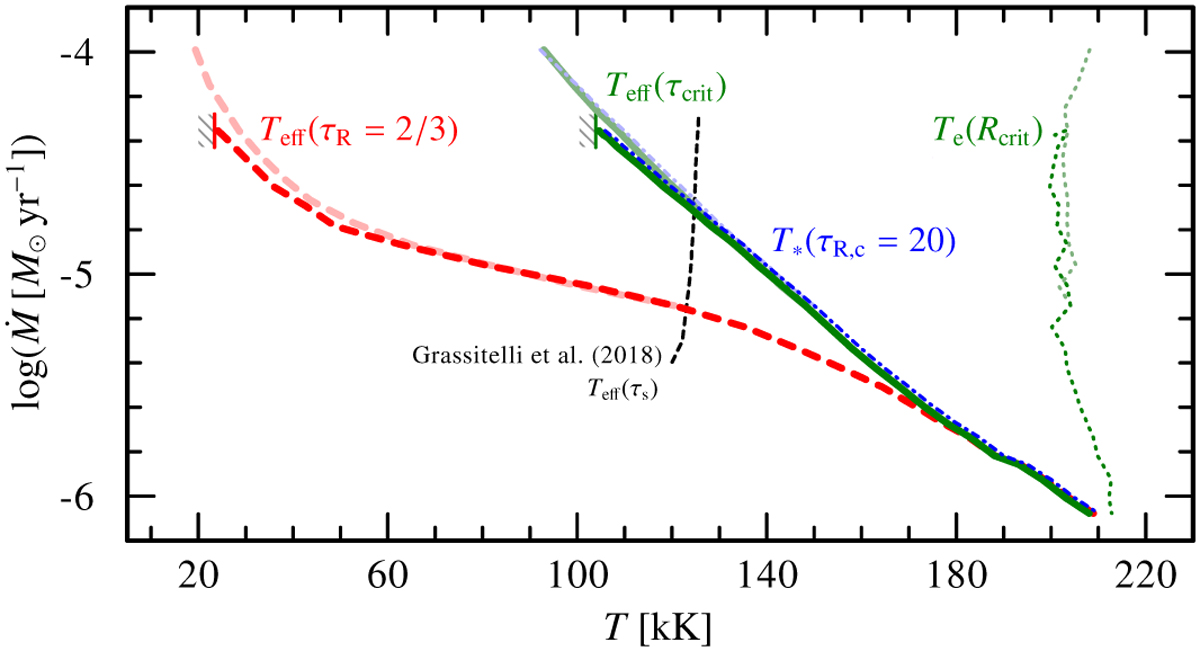
Fig. 7
Download original image
Same as Fig. 6, but for a model sequence with log L/L⊙ = 5.475, M = 15 M⊙, and ХH = 0. Contrary to the situation in Fig. 6 for a 20 M⊙ star, there is an abrupt breakdown of solutions beyond a minimum temperature and a maximum Ṁ. For the T2/з- and Teff(τcrit)-scales these points are marked with a vertical line attached to a gray-hatched area.
Current usage metrics show cumulative count of Article Views (full-text article views including HTML views, PDF and ePub downloads, according to the available data) and Abstracts Views on Vision4Press platform.
Data correspond to usage on the plateform after 2015. The current usage metrics is available 48-96 hours after online publication and is updated daily on week days.
Initial download of the metrics may take a while.