Fig. 6
Download original image
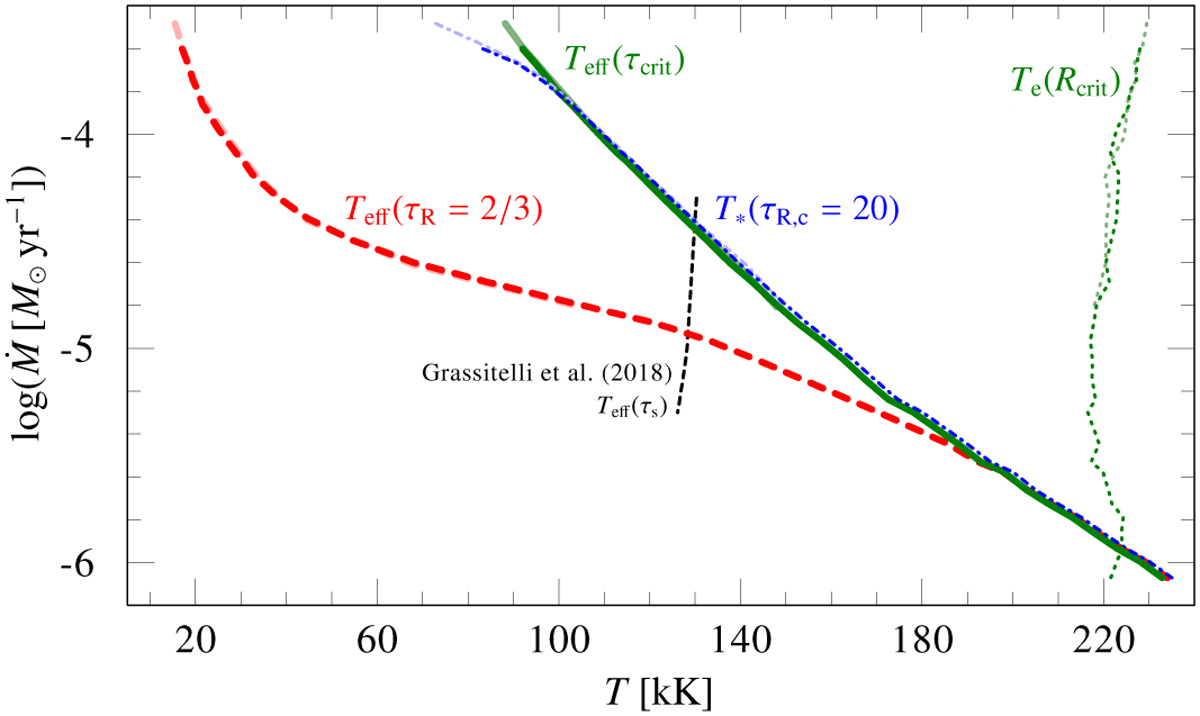
Mass-loss rates versus different temperature scales for a series of dynamically consistent atmosphere models with log L/L⊙ = 5.7, M = 20 M⊙, and ХH = 0: the thick red dashed line denotes the effective temperatures defined at a Rosseland optical depth of τR = 2/3, while the green solid line and the blue dashed-dotted line denote the effective temperatures referring to τcrit and τR,cort = 20, respectively. The green dotted line on the right denotes the (electron) temperature at the critical point. Curves in lighter colors reflect models using the simple integration treatment suppressing negative velocity gradients (cf. Sect. 2). The black dashed line shows the hydrodynamic structure solutions by Grassitelli et al. (2018).
Current usage metrics show cumulative count of Article Views (full-text article views including HTML views, PDF and ePub downloads, according to the available data) and Abstracts Views on Vision4Press platform.
Data correspond to usage on the plateform after 2015. The current usage metrics is available 48-96 hours after online publication and is updated daily on week days.
Initial download of the metrics may take a while.