Fig. D.1
Download original image
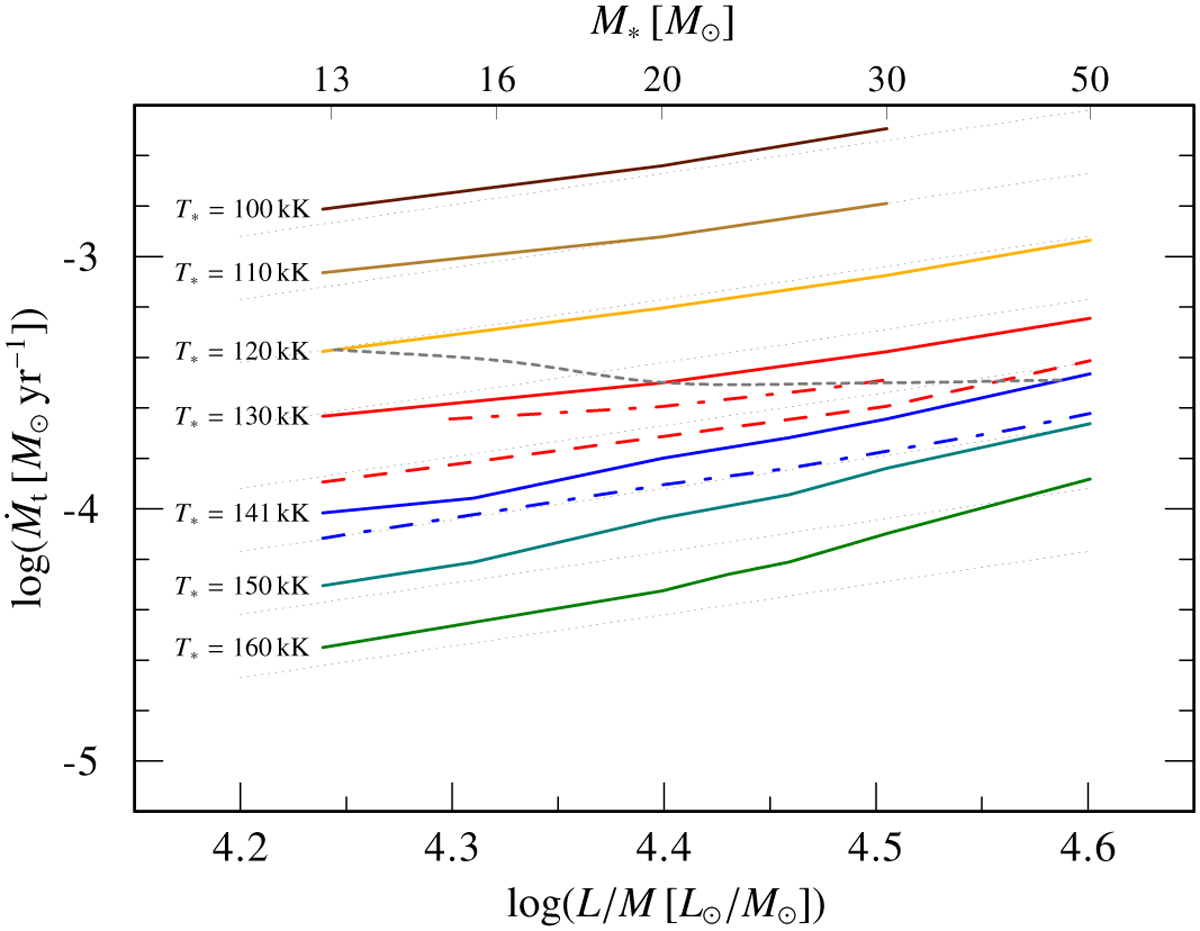
Transformed mass-loss rate ![]() as a function of L/M for different sequences varying in T*. All models use XH = 0.2 except the dashed-dotted sequences having XH = 0 for comparison. Apart from the red, dashed sequence (using D∞ = 10), all sequences employ D∞ = 50. The gray, dotted line is an interpolation of the solid sequences along the theoretical temperatures for the He ZAMS from Grassitelli et al. (2018) and Langer (1989). The light dotted linear curves in the background indicate the slope of 1.25 which is used in Eq. (D.4) and onward.
as a function of L/M for different sequences varying in T*. All models use XH = 0.2 except the dashed-dotted sequences having XH = 0 for comparison. Apart from the red, dashed sequence (using D∞ = 10), all sequences employ D∞ = 50. The gray, dotted line is an interpolation of the solid sequences along the theoretical temperatures for the He ZAMS from Grassitelli et al. (2018) and Langer (1989). The light dotted linear curves in the background indicate the slope of 1.25 which is used in Eq. (D.4) and onward.
Current usage metrics show cumulative count of Article Views (full-text article views including HTML views, PDF and ePub downloads, according to the available data) and Abstracts Views on Vision4Press platform.
Data correspond to usage on the plateform after 2015. The current usage metrics is available 48-96 hours after online publication and is updated daily on week days.
Initial download of the metrics may take a while.