Fig. 15
Download original image
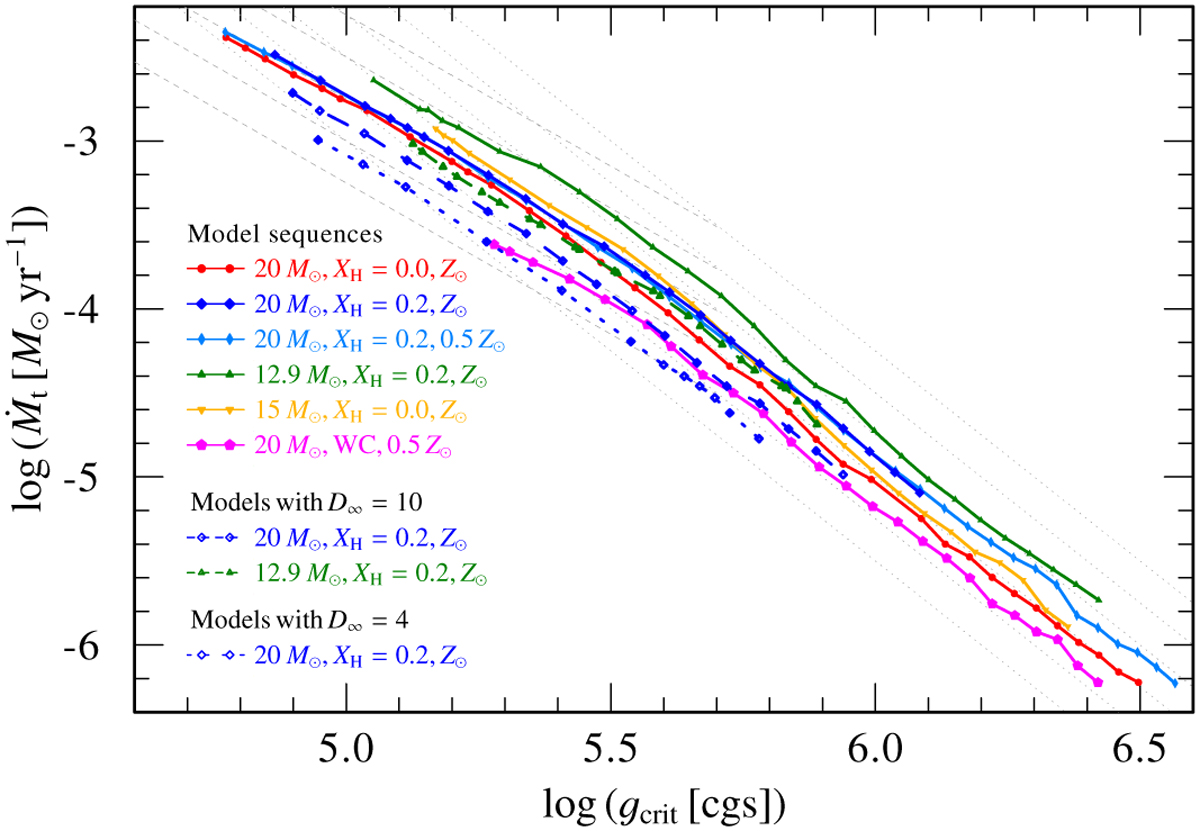
Transformed mass-loss rate ![]() as a function of the gravitational acceleration at the critical radius
as a function of the gravitational acceleration at the critical radius ![]() . To reflect the expected trends from the Rcrit-fits, thin gray lines are plotted in the background. The dotted, gray lines indicate
. To reflect the expected trends from the Rcrit-fits, thin gray lines are plotted in the background. The dotted, gray lines indicate ![]() (optically thin regime), while the dashed, gray lines correspond to
(optically thin regime), while the dashed, gray lines correspond to ![]() (optically thick regime).
(optically thick regime).
Current usage metrics show cumulative count of Article Views (full-text article views including HTML views, PDF and ePub downloads, according to the available data) and Abstracts Views on Vision4Press platform.
Data correspond to usage on the plateform after 2015. The current usage metrics is available 48-96 hours after online publication and is updated daily on week days.
Initial download of the metrics may take a while.