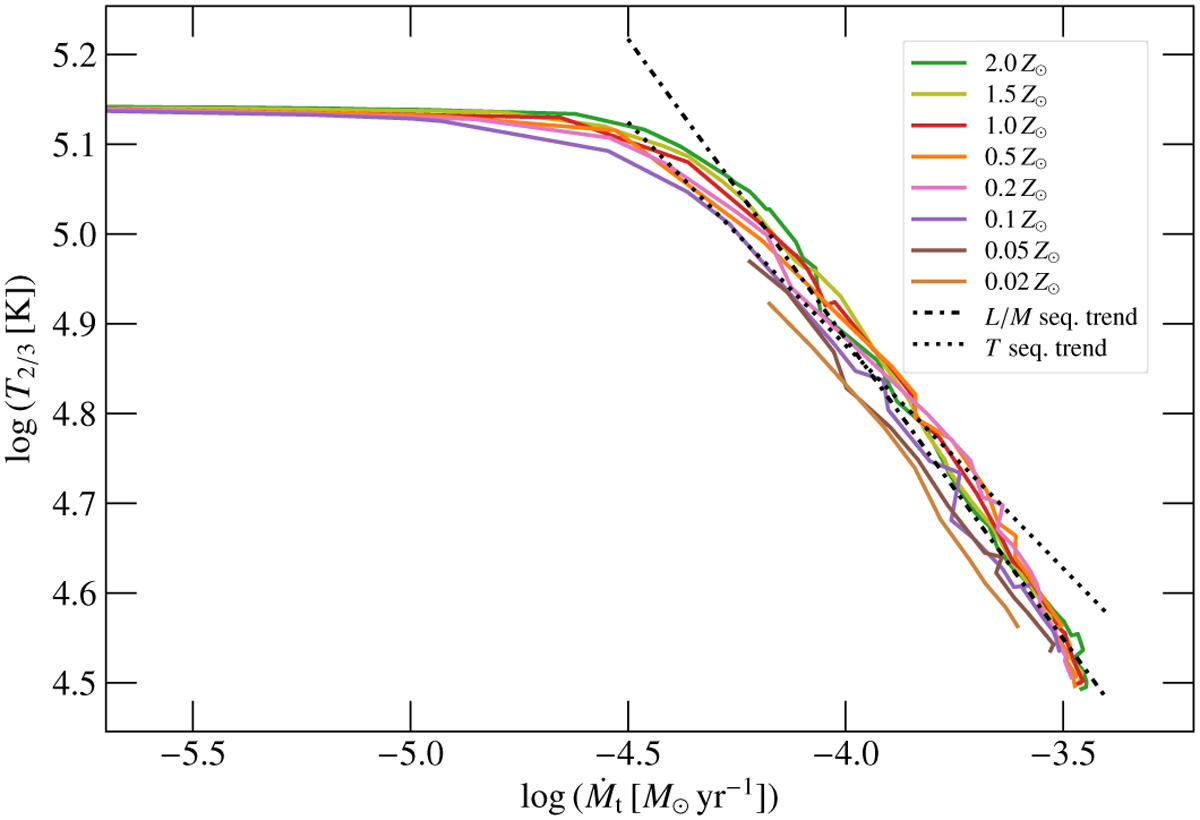
Fig. 12
Download original image
Effective temperature at a Rosseland optical depth of 2/3 as a function of the transformed mass-loss rate Ṁt for the whole set of models from Sander & Vink (2020). For log (Ṁt [M⊙ yr−1]) < −5.5, T2/3 is effectively independent of Ṁt. In Sander & Vink (2020), the value of T* is fixed for all models, but the difference in L/M still yields a wide range of T2/з values. The dashed-dotted line represents a linear fit of the temperature trend for log (Ṁt [M⊙ yr−1]) > −4.5 while the dotted curve represents the fit for the new model sequence illustrated in Fig. 11.
Current usage metrics show cumulative count of Article Views (full-text article views including HTML views, PDF and ePub downloads, according to the available data) and Abstracts Views on Vision4Press platform.
Data correspond to usage on the plateform after 2015. The current usage metrics is available 48-96 hours after online publication and is updated daily on week days.
Initial download of the metrics may take a while.