Fig. 11
Download original image
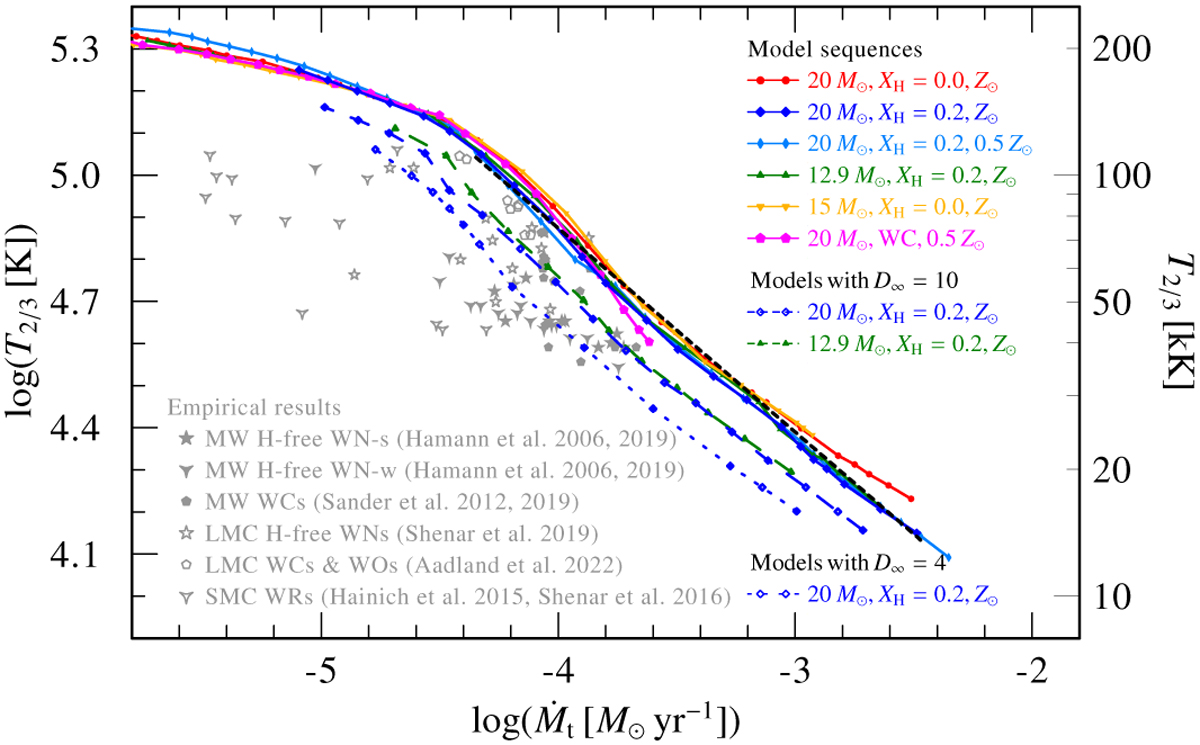
Effective temperature at a Rosseland optical depth of 2/3 as a function of the transformed mass-loss rate Ṁt for our new calculated model sequences. The sequences connected by solid lines all employ D∞ = 50, while those with dashed and dotted curves indicate sequences using D∞ = 10 and 4, respectively, as indicated in the plot. For comparison, also various empirical results from the literature are depicted by discrete, gray symbols.
Current usage metrics show cumulative count of Article Views (full-text article views including HTML views, PDF and ePub downloads, according to the available data) and Abstracts Views on Vision4Press platform.
Data correspond to usage on the plateform after 2015. The current usage metrics is available 48-96 hours after online publication and is updated daily on week days.
Initial download of the metrics may take a while.