Fig. 8.
Download original image
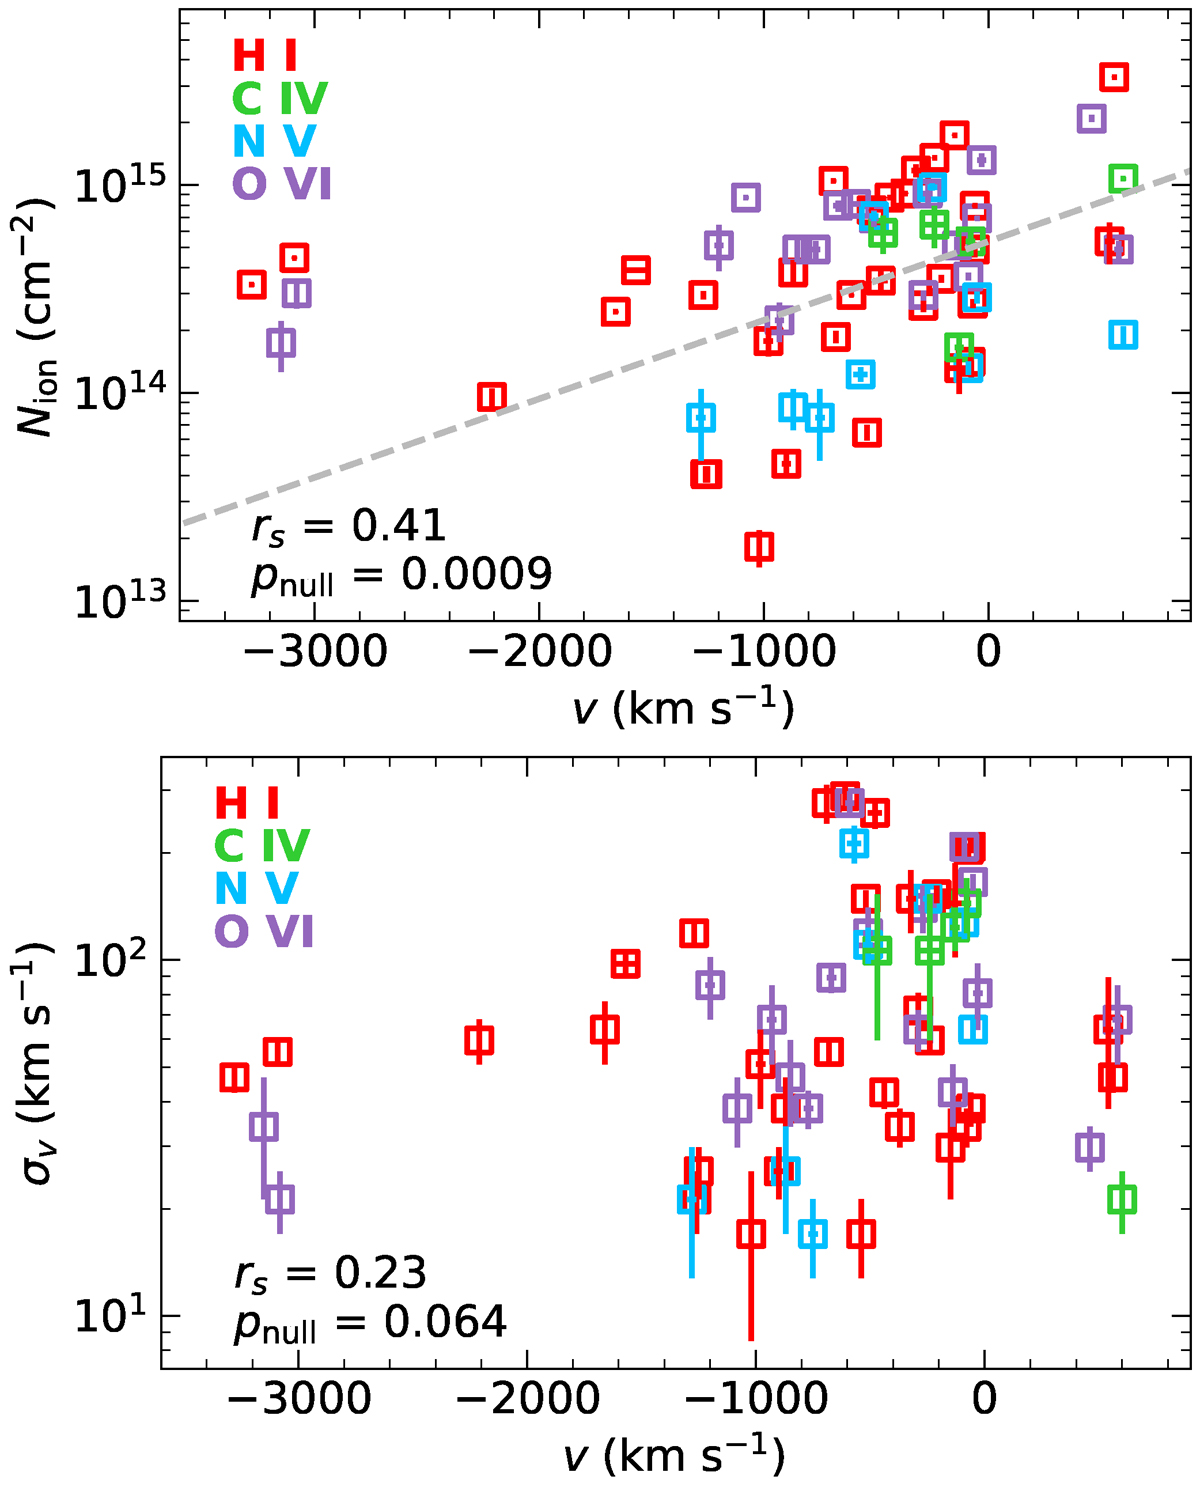
Column density Nion (top panel) and turbulent velocity, σv, (bottom panel) plotted versus the flow velocity, v, of the intrinsic UV absorption lines detected in the SUBWAYS HST sample. The data points correspond to the best-fit parameters of Table A.2. The σv is calculated from the FWHM of the absorption line according to ![]() . The Spearman’s rank correlation coefficient, rs, and the null hypothesis probability, pnull, are given in the inset. There is a statistically significant correlation between Nion and v, even including the four outlier data points on the far left, which belong to only one object (PG 1307+085). All data points with a positive value for v (i.e., inflow) belong to only one component of one object (Comp. 1 of PG 0804+761). All other targets show only outflows.
. The Spearman’s rank correlation coefficient, rs, and the null hypothesis probability, pnull, are given in the inset. There is a statistically significant correlation between Nion and v, even including the four outlier data points on the far left, which belong to only one object (PG 1307+085). All data points with a positive value for v (i.e., inflow) belong to only one component of one object (Comp. 1 of PG 0804+761). All other targets show only outflows.
Current usage metrics show cumulative count of Article Views (full-text article views including HTML views, PDF and ePub downloads, according to the available data) and Abstracts Views on Vision4Press platform.
Data correspond to usage on the plateform after 2015. The current usage metrics is available 48-96 hours after online publication and is updated daily on week days.
Initial download of the metrics may take a while.