Open Access
Fig. A.2.
Download original image
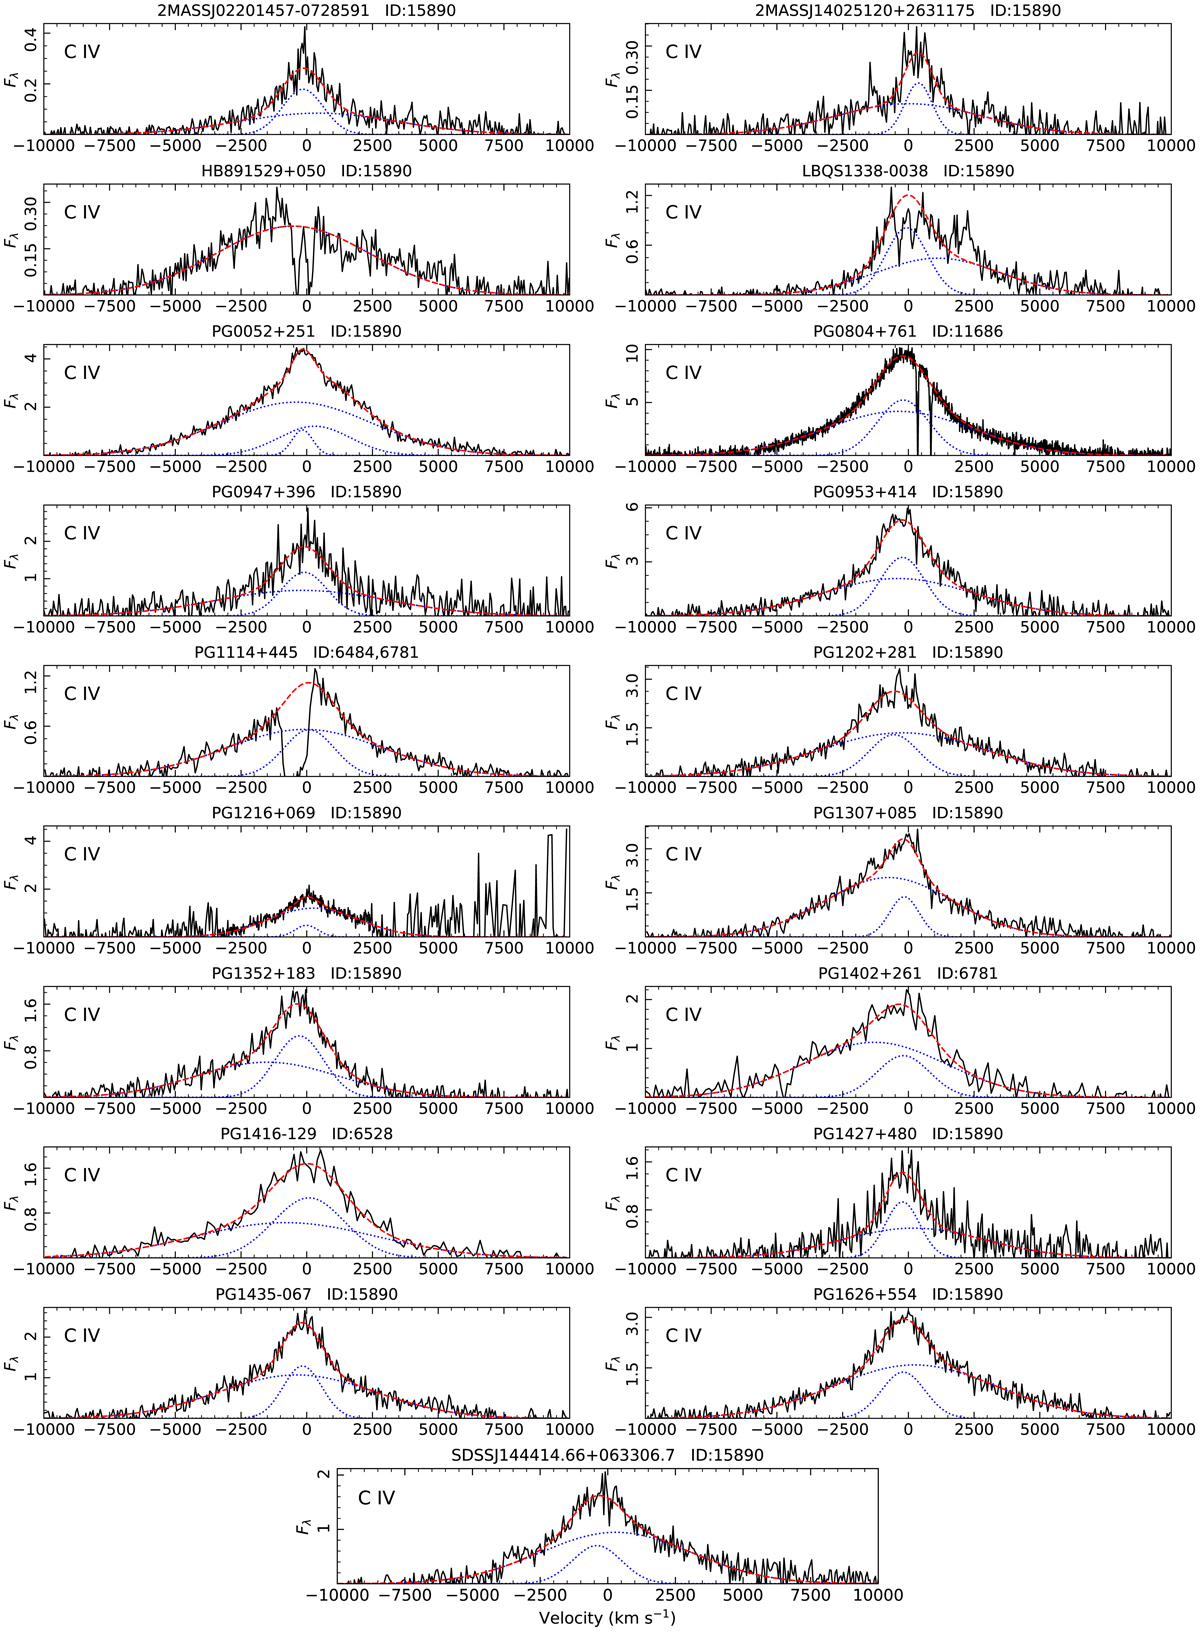
C IV emission lines of the SUBWAYS sample. The HST UV spectra (in black) are continuum-subtracted. The total emission-line model is shown in dashed red line, and its individual emission components (Table A.1) in dotted blue line. The observed flux Fλ is in 10−14 erg s−1 cm−2 Å−1.
Current usage metrics show cumulative count of Article Views (full-text article views including HTML views, PDF and ePub downloads, according to the available data) and Abstracts Views on Vision4Press platform.
Data correspond to usage on the plateform after 2015. The current usage metrics is available 48-96 hours after online publication and is updated daily on week days.
Initial download of the metrics may take a while.