Fig. 10.
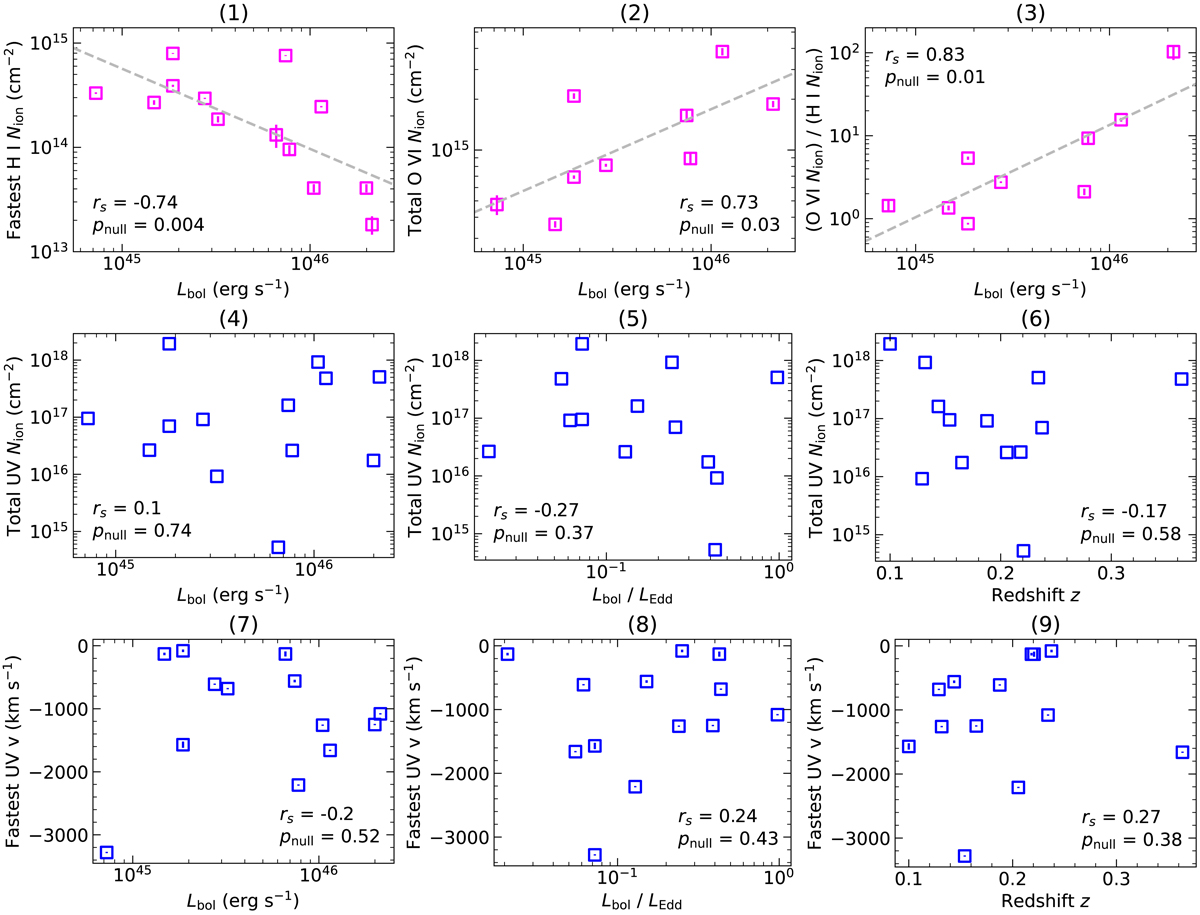
Download original image
Relations between parameters of the UV outflows and other AGN parameters in the SUBWAYS HST sample. In the corner of each panel, the Spearman’s rank correlation coefficient, rs, and the null hypothesis probability, pnull, are given. In panels with statistically significant correlations (pnull < 0.05) the data points are displayed in magenta and in those with no significant correlation in blue. The UV measurement uncertainties are displayed in this figure, however, they are significantly smaller than the explored scales.
Current usage metrics show cumulative count of Article Views (full-text article views including HTML views, PDF and ePub downloads, according to the available data) and Abstracts Views on Vision4Press platform.
Data correspond to usage on the plateform after 2015. The current usage metrics is available 48-96 hours after online publication and is updated daily on week days.
Initial download of the metrics may take a while.