Open Access
Fig. 9.
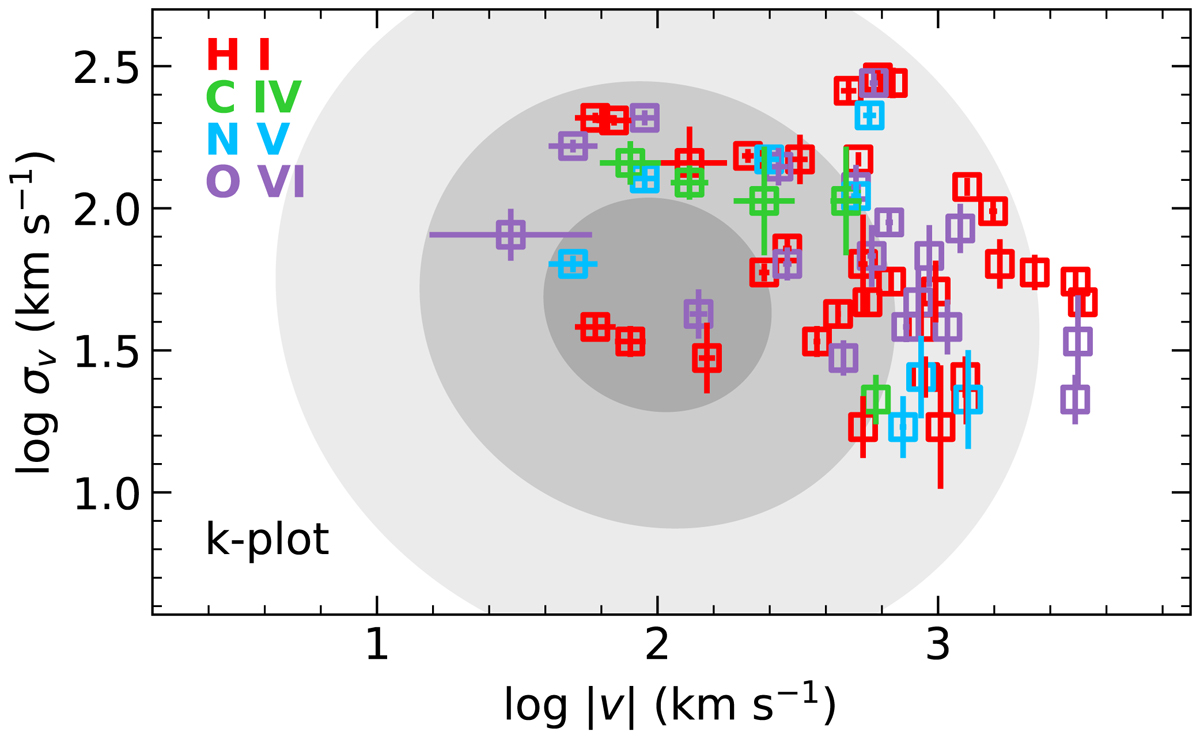
Download original image
Diagnostic kinematic plot (k-plot) for the intrinsic UV absorbers in the SUBWAYS sample, where the log of turbulent velocity σv is plotted versus the log of the flow velocity v. The SUBWAYS measurements are over-plotted on the 1–3σ confidence contours of the CCA simulations from Gaspari et al. (2018).
Current usage metrics show cumulative count of Article Views (full-text article views including HTML views, PDF and ePub downloads, according to the available data) and Abstracts Views on Vision4Press platform.
Data correspond to usage on the plateform after 2015. The current usage metrics is available 48-96 hours after online publication and is updated daily on week days.
Initial download of the metrics may take a while.