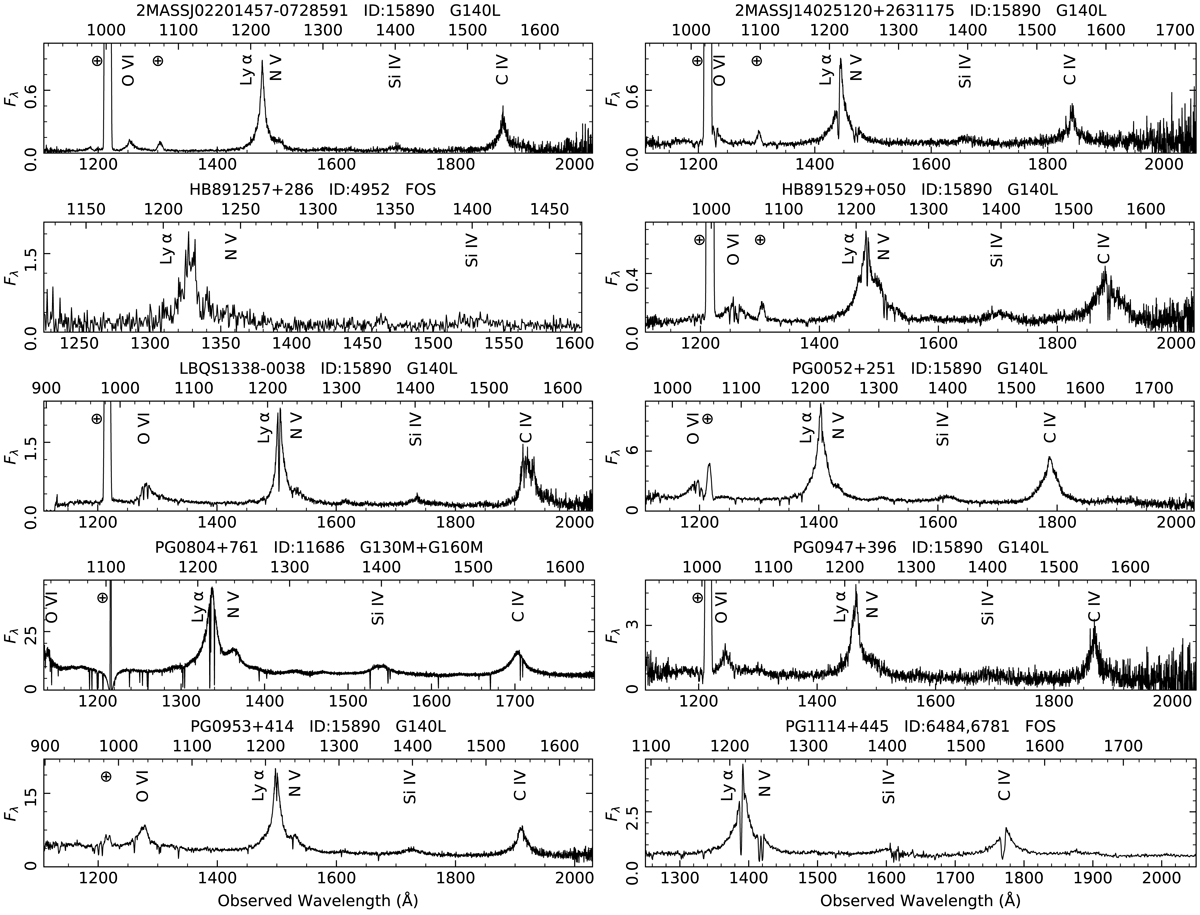
Fig. 1.

Download original image
Overview of the HST spectra of the AGN in the SUBWAYS sample. The observed flux Fλ is in units of 10−14 erg s−1 cm−2 Å−1. The observed (bottom axis) and rest-frame (top axis) wavelengths are shown in each panel. The most prominent AGN emission features are labeled. The geocoronal emission lines are indicated with the symbol ⊕. The “ID” label on the panels of this figure and the subsequent figures refers to the HST proposal ID number (Table 1). The figure is continued on the next page.
Current usage metrics show cumulative count of Article Views (full-text article views including HTML views, PDF and ePub downloads, according to the available data) and Abstracts Views on Vision4Press platform.
Data correspond to usage on the plateform after 2015. The current usage metrics is available 48-96 hours after online publication and is updated daily on week days.
Initial download of the metrics may take a while.


