Fig. 9.
Download original image
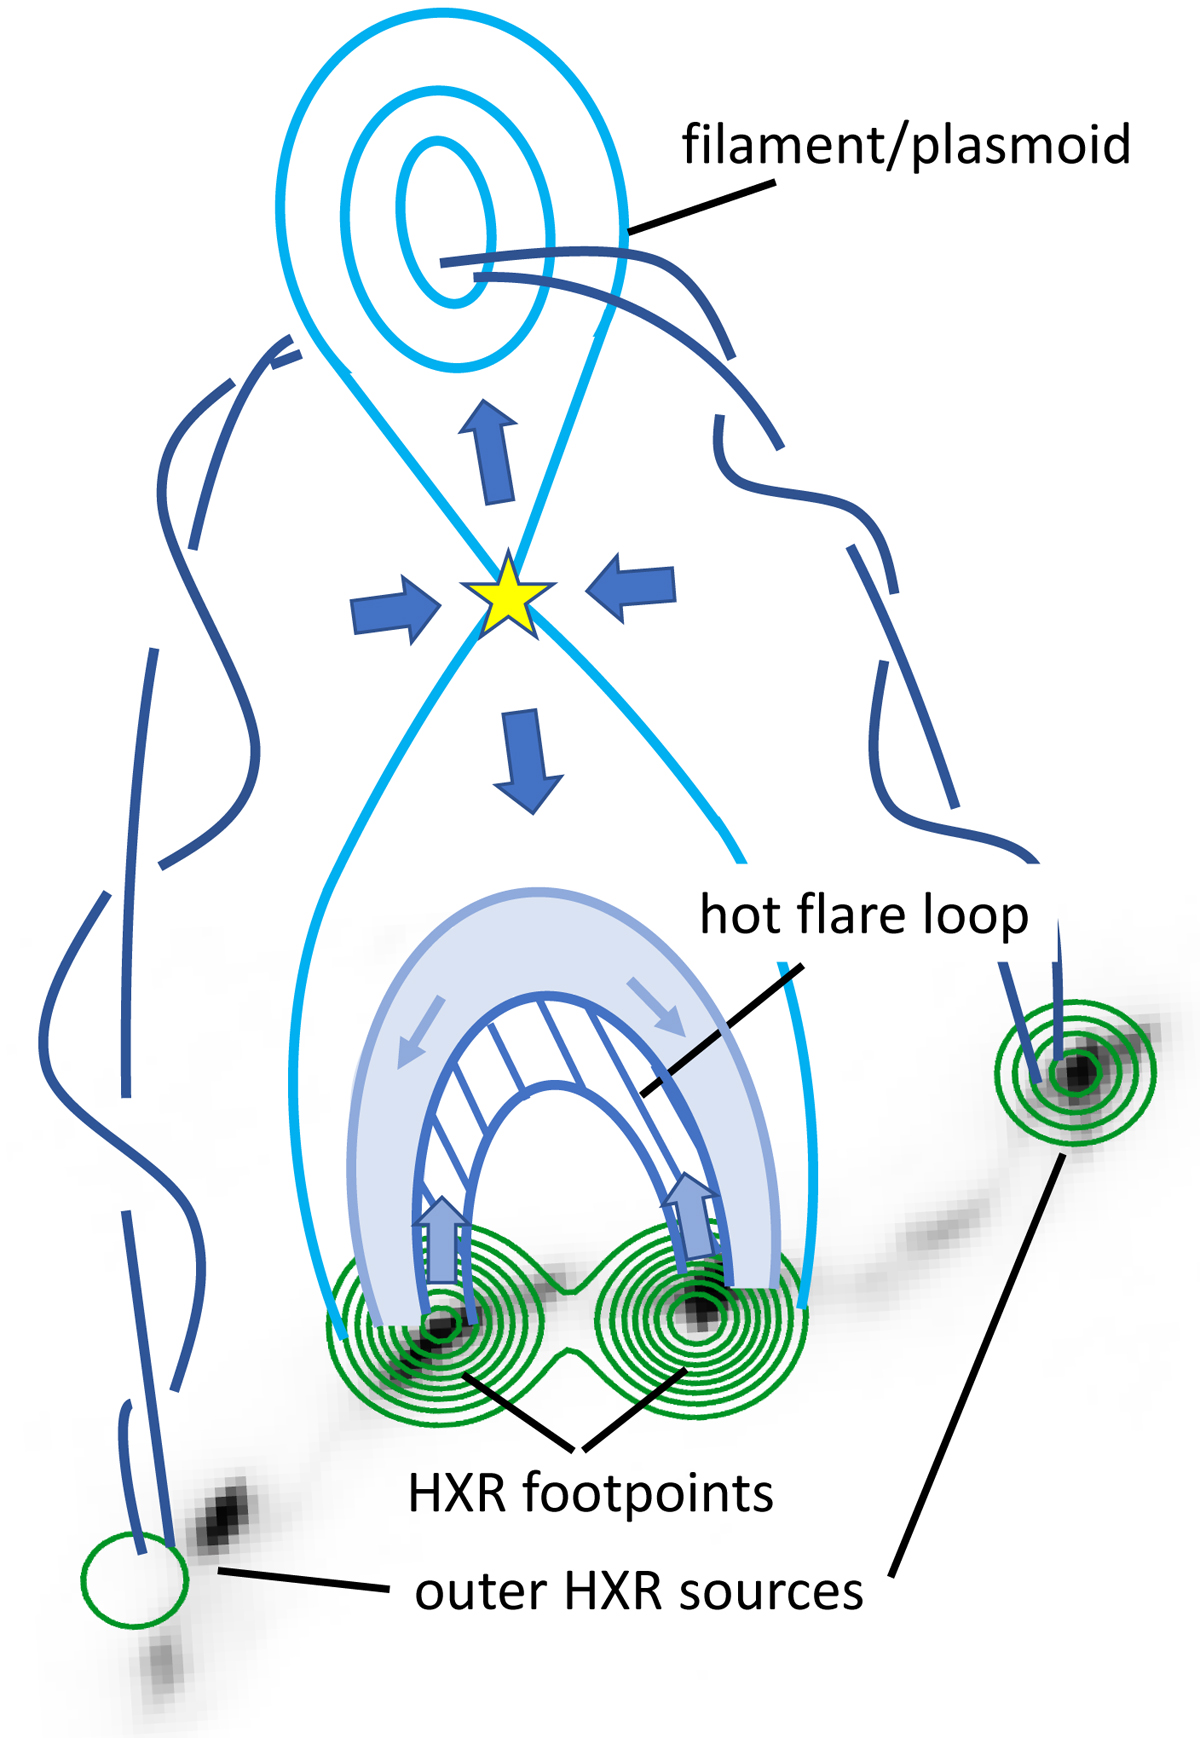
Cartoon of the presented flare during the onset of the impulsive phase. The background image, which is the same as the left panel of Fig. 3, shows the contour levels of the four sources observed by STIX in the nonthermal energy range 22−28 keV, overlaid on the reprojected AIA 1600 Å map. Additionally, the standard model for solar flares is represented. The outer sources in hard X-rays from the anchor points of the erupting filament are the new contribution to the standard flare picture.
Current usage metrics show cumulative count of Article Views (full-text article views including HTML views, PDF and ePub downloads, according to the available data) and Abstracts Views on Vision4Press platform.
Data correspond to usage on the plateform after 2015. The current usage metrics is available 48-96 hours after online publication and is updated daily on week days.
Initial download of the metrics may take a while.