Fig. 8.
Download original image
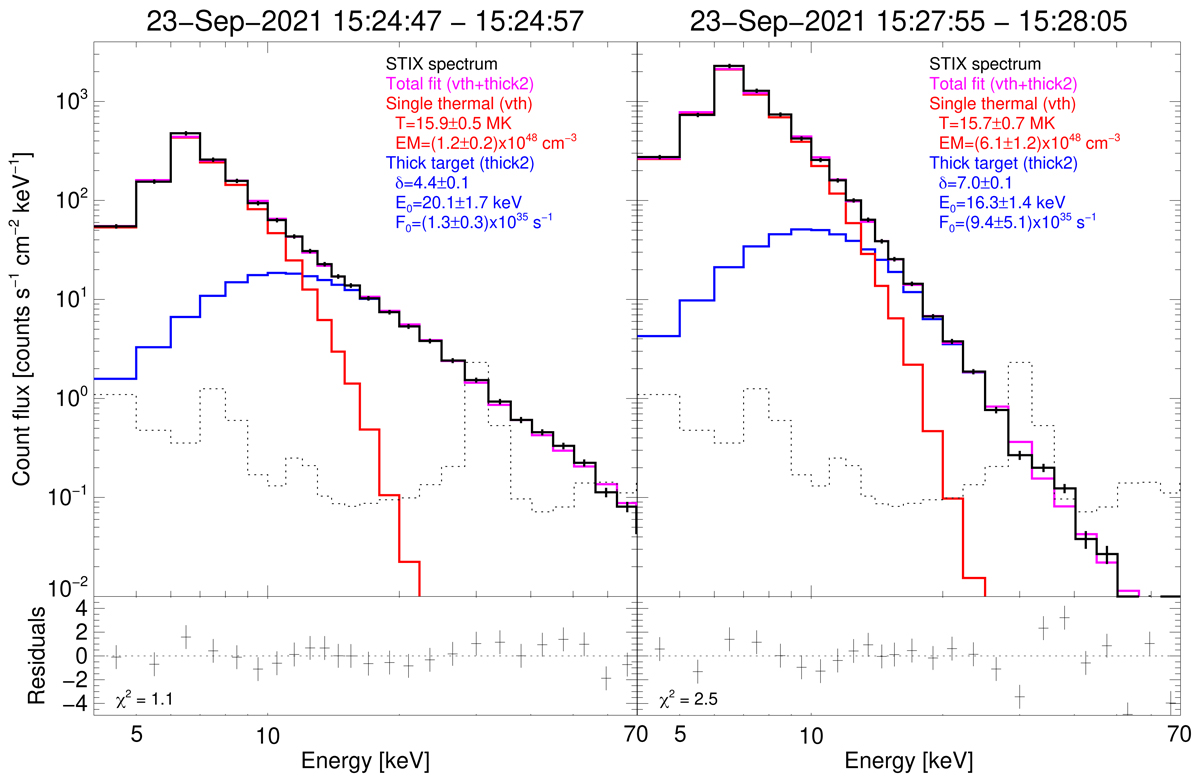
STIX background-subtracted count flux spectra around the nonthermal (left) and thermal (right) peaks. Both spectra can be well fit with an isothermal (red) component plus a thick target model (blue). The magenta curves correspond to the sum of the two components, and the dashed black curves represent the STIX background spectra taken during nonflaring times close to the event. Below each spectrum, we report the residuals (observations minus total fit) in units of the standard deviation calculated from counting statistics. The resulting fit parameters are shown in the legend of each plot.
Current usage metrics show cumulative count of Article Views (full-text article views including HTML views, PDF and ePub downloads, according to the available data) and Abstracts Views on Vision4Press platform.
Data correspond to usage on the plateform after 2015. The current usage metrics is available 48-96 hours after online publication and is updated daily on week days.
Initial download of the metrics may take a while.