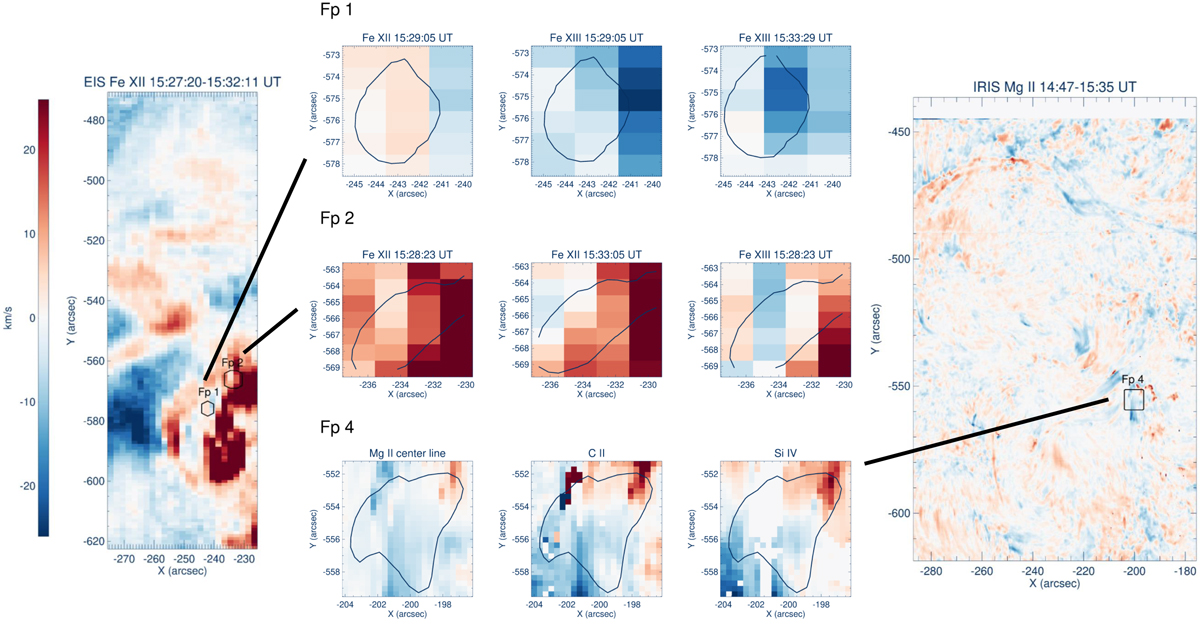
Fig. 7.
Download original image
Doppler velocities measured by EIS and IRIS. The leftmost and rightmost panels are the whole raster frames from EIS and IRIS, respectively. In the frames we mark the regions around Fp 1, Fp 2, and Fp 4. These regions are shown in more detail for different emission lines and at different times in the nine middle panels. The top row of the compilation shows the measurement of EIS around Fp 1, the middle row the measurement of EIS around Fp 2, and the bottom row the measurement of IRIS around Fp 4. The dark blue contours are the 20% contours of AIA 1600 Å showing the three sources Fp 1, Fp 2, and Fp 4.
Current usage metrics show cumulative count of Article Views (full-text article views including HTML views, PDF and ePub downloads, according to the available data) and Abstracts Views on Vision4Press platform.
Data correspond to usage on the plateform after 2015. The current usage metrics is available 48-96 hours after online publication and is updated daily on week days.
Initial download of the metrics may take a while.