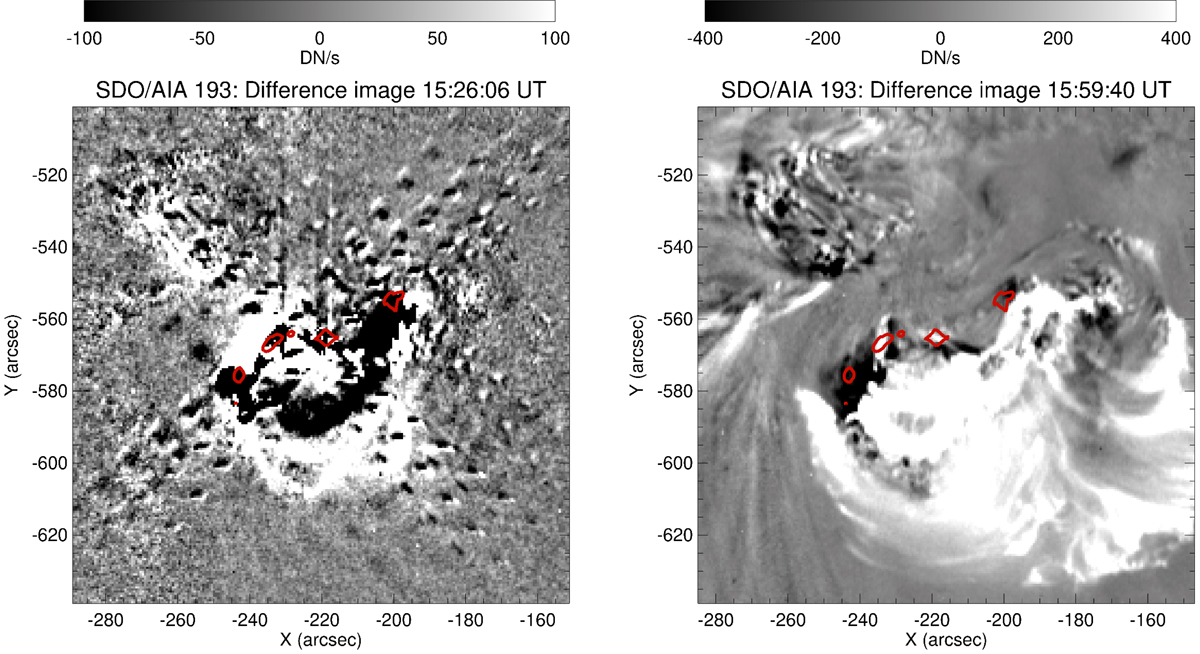
Fig. 6.
Download original image
Difference images of the AIA 193 Å filter at two different times to visualize the propagation of the CME. The left panel is an image from a running-difference movie during the impulsive phase of the flare, and the right panel is a difference image taken 35 min after the flare onset. A preflare image is subtracted to identify the dimming regions. The diagonal lines in the left panel are diffraction patterns. The red 40% contours show the location of the four sources as seen by AIA 1600 Å in the impulsive phase for reference.
Current usage metrics show cumulative count of Article Views (full-text article views including HTML views, PDF and ePub downloads, according to the available data) and Abstracts Views on Vision4Press platform.
Data correspond to usage on the plateform after 2015. The current usage metrics is available 48-96 hours after online publication and is updated daily on week days.
Initial download of the metrics may take a while.