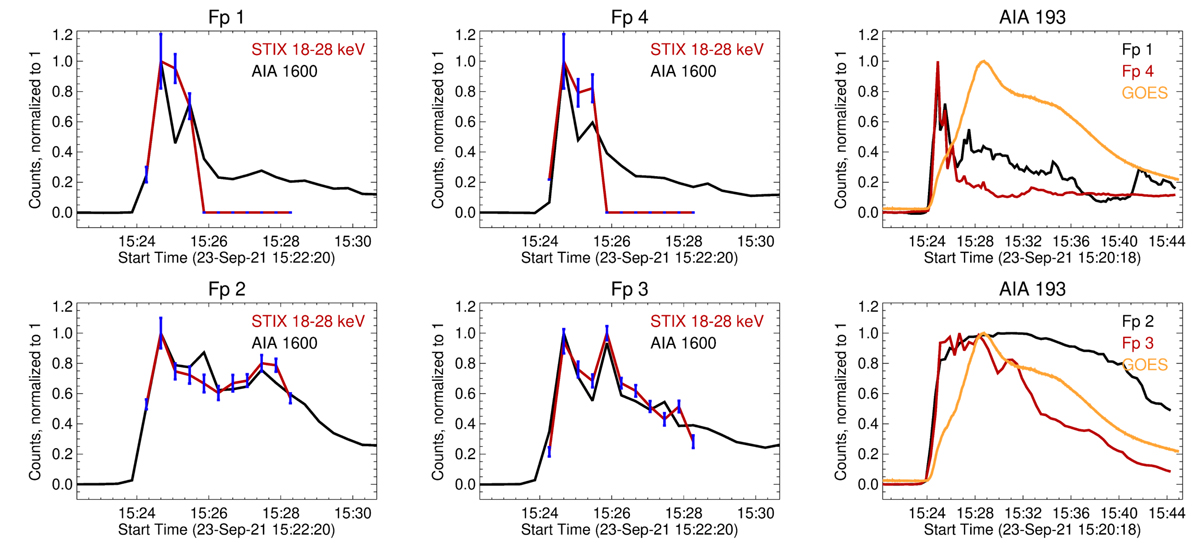
Fig. 5.
Download original image
Time evolution plots with maximum value normalised to one. The left and middle column are the intensity plots of AIA 1600 Å (black) and nonthermal STIX (red, with error bars in blue) for the four sources individually. The right column shows the intensity plots of AIA 193 Å (black and red) for the four sources. As a reference, we added the GOES curve (orange).
Current usage metrics show cumulative count of Article Views (full-text article views including HTML views, PDF and ePub downloads, according to the available data) and Abstracts Views on Vision4Press platform.
Data correspond to usage on the plateform after 2015. The current usage metrics is available 48-96 hours after online publication and is updated daily on week days.
Initial download of the metrics may take a while.