Fig. 4.
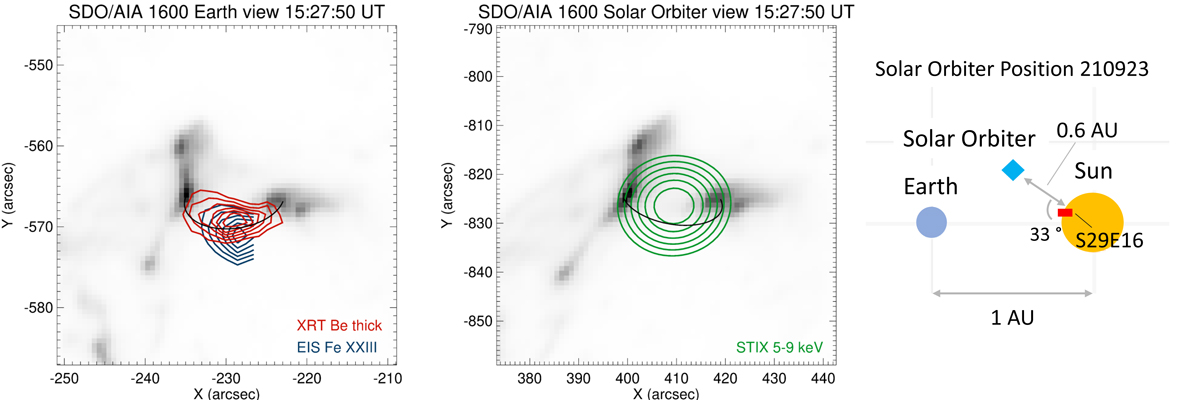
Download original image
Comparison between the Earth and the Solar Orbiter vantage point during the 23 September 2021 flaring event (left and middle panel, respectively). In the left panel, the 40−90% contours of the XRT Be thick filter (red) and the contours of the emission line Fe XXIII of EIS (blue) are overlaid on the AIA 1600 Å. In the middle panel, the 40−90% contours of the STIX image of the thermal emission (green) reconstructed in the 5−9 keV range are overlaid on the reprojected AIA map. The black loop in the left panel is drawn to indicate a potential flare loop. The same black loop is shown in the middle panel, but reprojected according to the viewing angle of Solar Orbiter. These images were taken at the peak of the thermal emission of this flare, roughly 3 min later than the images shown in Fig. 3. The field of view of the middle panel is shown by the yellow box in Fig. 3. The right panel shows the relative locations of the Sun, Earth, and Solar Orbiter. The distance of Solar Orbiter to the Sun is 0.6 AU.
Current usage metrics show cumulative count of Article Views (full-text article views including HTML views, PDF and ePub downloads, according to the available data) and Abstracts Views on Vision4Press platform.
Data correspond to usage on the plateform after 2015. The current usage metrics is available 48-96 hours after online publication and is updated daily on week days.
Initial download of the metrics may take a while.