Fig. 3.
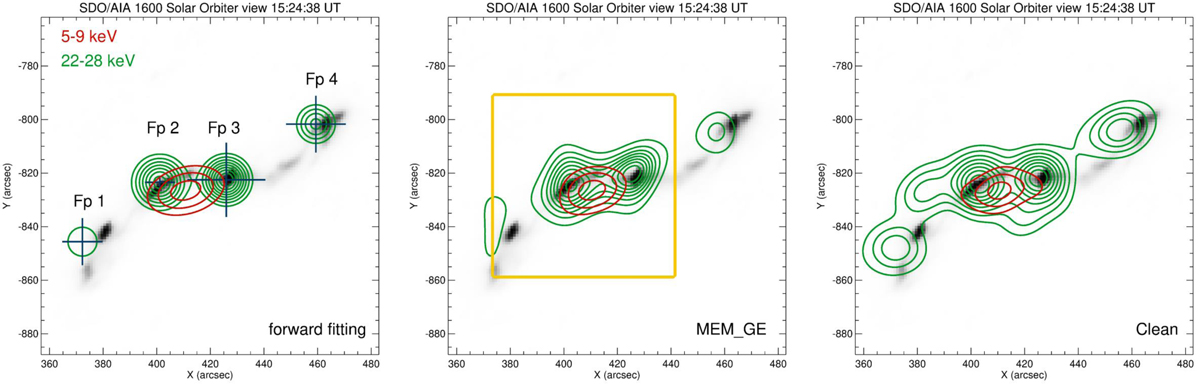
Download original image
Level curves of the STIX reconstructions obtained with forward fit, MEM_GE, and Clean (left, middle, and right panels, respectively), overlaid on the reprojected AIA 1600 Å map. The green contours (20−90% of the peak value) represent the nonthermal emission reconstructed in the 22−28 keV range, and the red contours (50, 70, and 90% of the peak value) represent the thermal emission reconstructed in the 5−9 keV range. For both energy intervals, the data were integrated over 48 s during the onset of the impulsive phase. In the left panel, the blue crosses represent the error bars on the x and y coordinates of each source location provided by forward fit. We indicate the four sources from left to right with Fp 1, Fp 2, Fp 3, and Fp 4. A total number of 584 271 and 11 189 counts were measured by the imaging detectors in the selected thermal and nonthermal energy ranges, respectively. The yellow box in the middle panel indicates the field of view shown in Fig. 4.
Current usage metrics show cumulative count of Article Views (full-text article views including HTML views, PDF and ePub downloads, according to the available data) and Abstracts Views on Vision4Press platform.
Data correspond to usage on the plateform after 2015. The current usage metrics is available 48-96 hours after online publication and is updated daily on week days.
Initial download of the metrics may take a while.