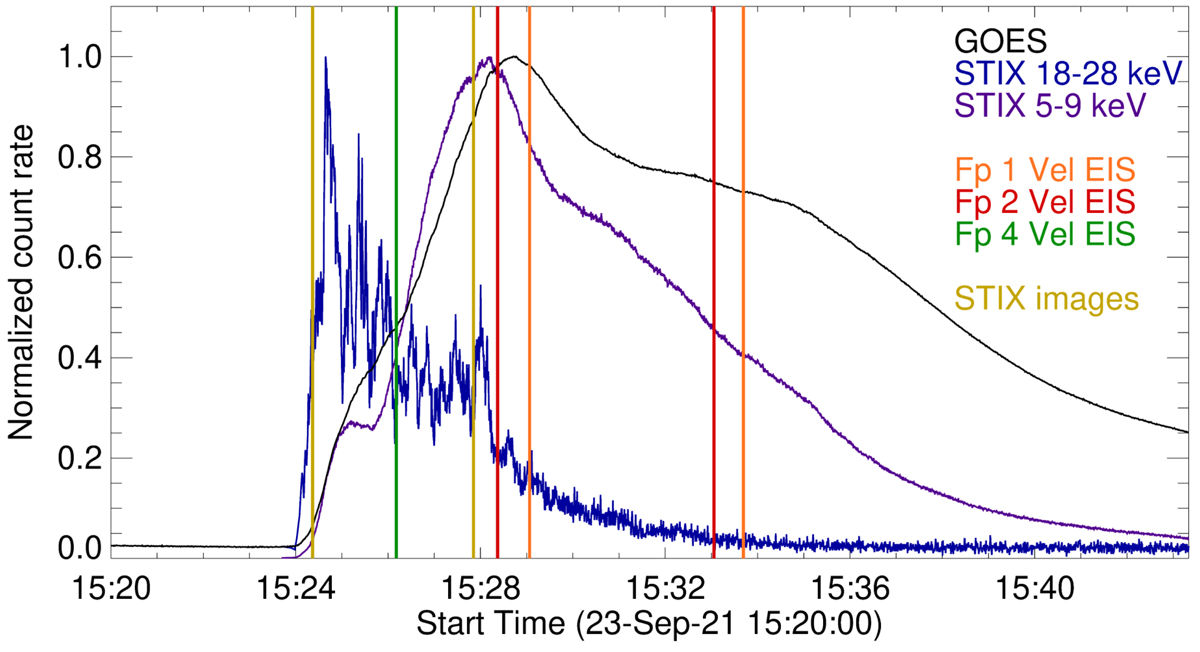
Fig. 2.
Download original image
Intensity evolution of the flare measured by GOES (black), STIX thermal (violet), and STIX nonthermal (blue) over the whole Sun. The maximum peak of each curve is normalized to one. We added the time stamps with observational coverage for the velocity measurements; see Sect. 3.5. The orange lines correspond to the time points when EIS measured at the position of Fp 1, the red lines when EIS measured at the position of Fp 2, and the green line when IRIS measured at the position of Fp 4. Furthermore, the integration times of the STIX images shown in Figs. 3 and 4 are delimited by the beige lines.
Current usage metrics show cumulative count of Article Views (full-text article views including HTML views, PDF and ePub downloads, according to the available data) and Abstracts Views on Vision4Press platform.
Data correspond to usage on the plateform after 2015. The current usage metrics is available 48-96 hours after online publication and is updated daily on week days.
Initial download of the metrics may take a while.