Fig. A.1.
Download original image
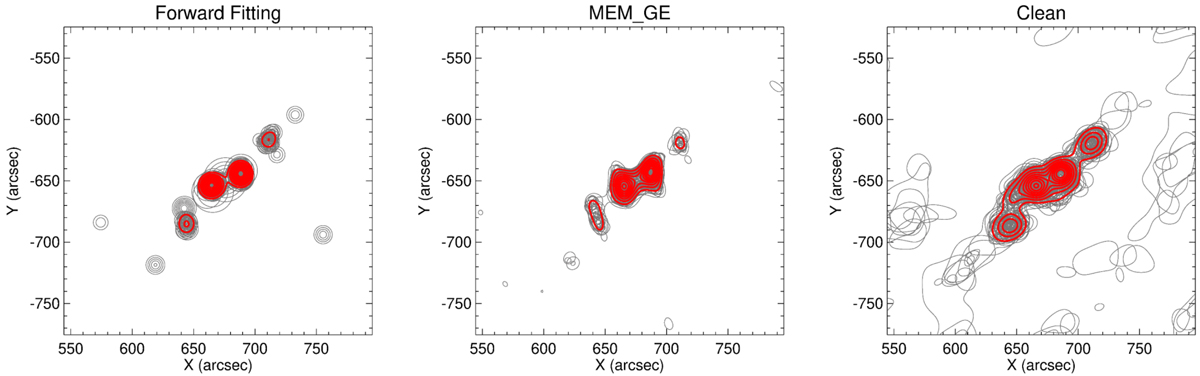
Results of the 20 reconstructions from perturbed data to determine the robustness of the imaging methods for STIX. The gray contours show the 20 reruns, and the red contours are the average over all runs. The contour levels are 20-90% of the maximum values. For the images, we used the time range 15:24:28 UT to 15:25:16 UT (these times are corrected for the light travel time to Earth, about 198.8 s) and the energy range 22-28 keV.
Current usage metrics show cumulative count of Article Views (full-text article views including HTML views, PDF and ePub downloads, according to the available data) and Abstracts Views on Vision4Press platform.
Data correspond to usage on the plateform after 2015. The current usage metrics is available 48-96 hours after online publication and is updated daily on week days.
Initial download of the metrics may take a while.