Fig. 8
Download original image
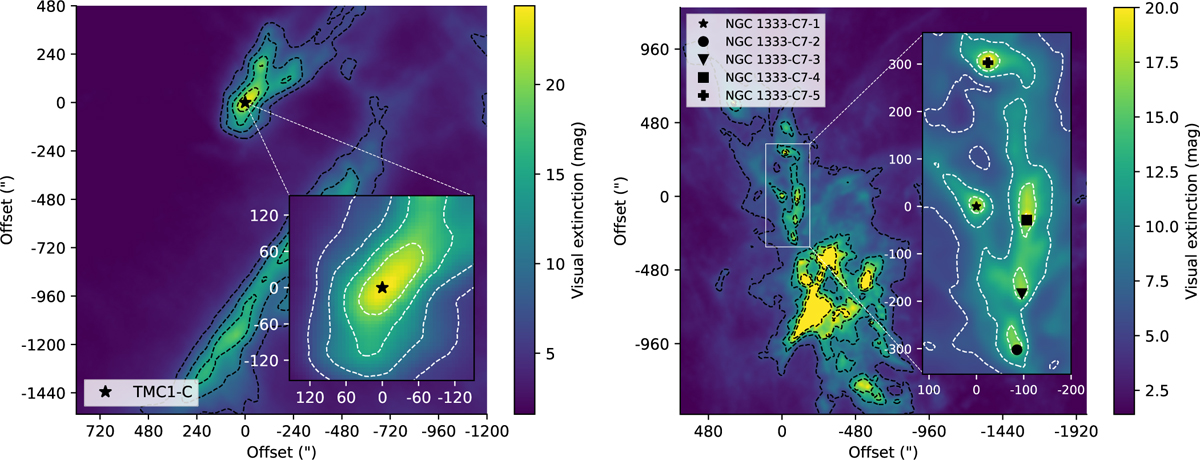
Visual extinction maps of the regions under study. Left panel: visual extinction map of TMC 1-C from the Berschel data (Kirk et al. in prep.). Contours represent levels of [6, 10, 15, 20, 25] mag. The origin (0,0) of this map corresponds to the position TMC 1-C (see Table 3). Right panel: visual extinction map of the northern sector of the NGC 1333 protocluster. The origin (0,0) of this map corresponds to the position NGC1333-C7-1 (see Table 3). Contours represent levels of [5, 10, 15, 20] mag.
Current usage metrics show cumulative count of Article Views (full-text article views including HTML views, PDF and ePub downloads, according to the available data) and Abstracts Views on Vision4Press platform.
Data correspond to usage on the plateform after 2015. The current usage metrics is available 48-96 hours after online publication and is updated daily on week days.
Initial download of the metrics may take a while.