Fig. 12
Download original image
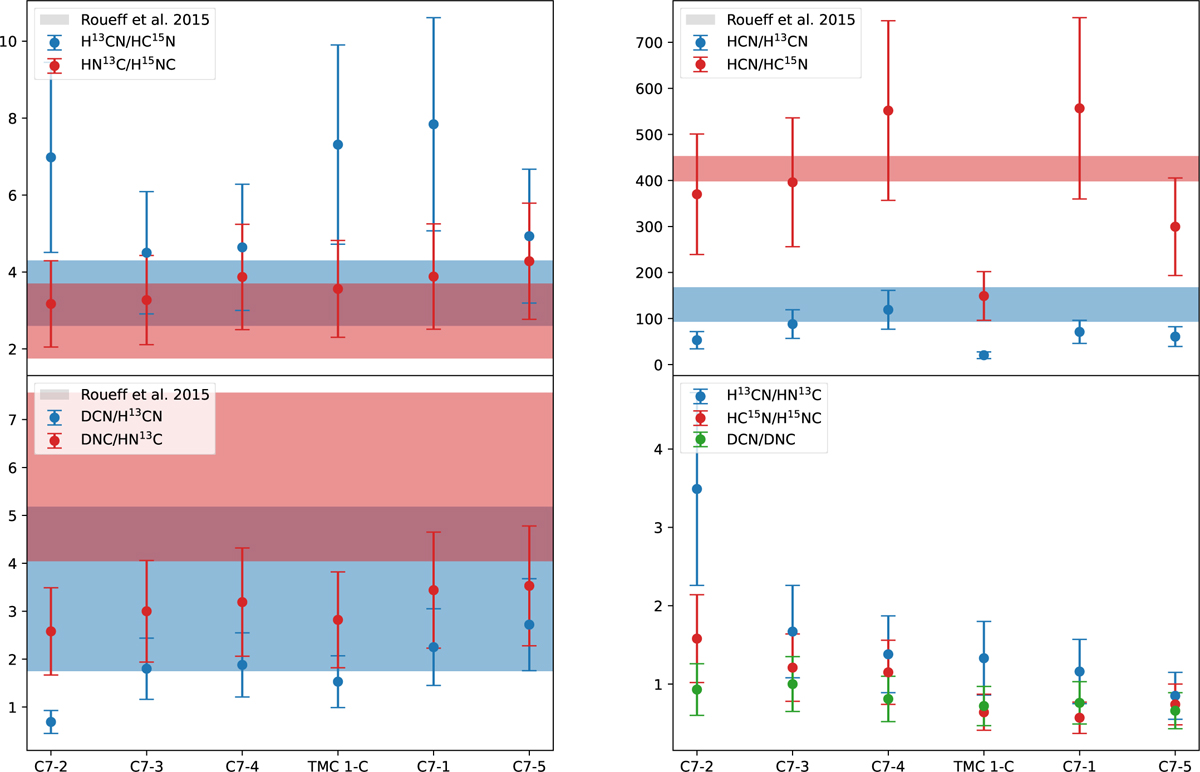
Comparison between the ratios observed in this paper and chemical models from the literature. Blue, red, and green dots represent the different observed molecular ratios across the positions analyzed in this paper. The horizontal bands span from the minimum to the maximum values for the ratios obtained in the models of Roueff et al. (2015). The sources are ordered by decreasing dust temperature.
Current usage metrics show cumulative count of Article Views (full-text article views including HTML views, PDF and ePub downloads, according to the available data) and Abstracts Views on Vision4Press platform.
Data correspond to usage on the plateform after 2015. The current usage metrics is available 48-96 hours after online publication and is updated daily on week days.
Initial download of the metrics may take a while.