Fig. 10
Download original image
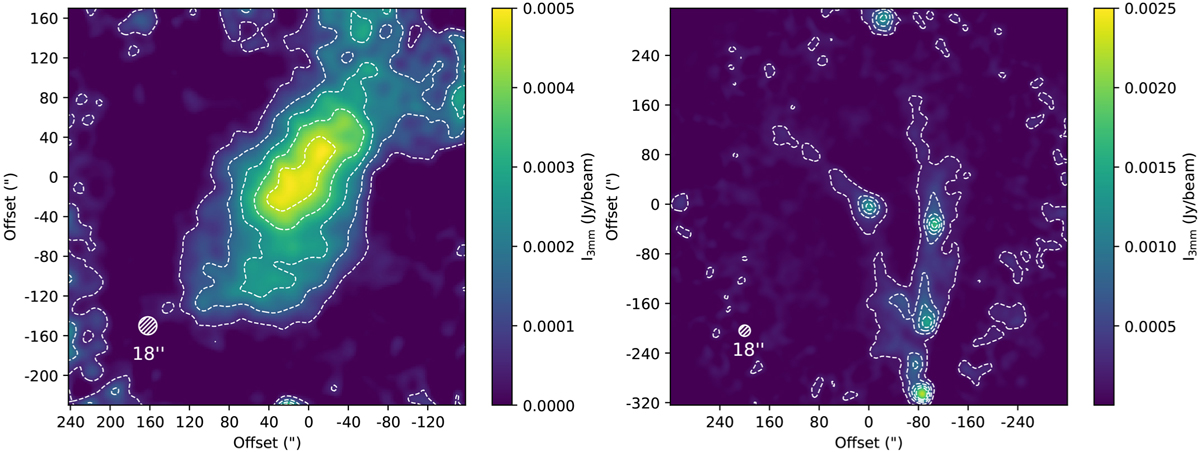
Continuum flux maps at 3 mm obtained with the MUSTANG-2 bolometer used to compute the dust emissivity spectral index β0.85-3mm. Left panel: flux at 3 mm in the TMC 1-C prestellar core. Contours correspond to levels 5σ × [1,3,5,7,9], with σ = 10−5 Jy beam−1. Right panel: flux at 3 mm in the NGC 1333-C7 sector. Contours correspond to levels 5σ × [1,3,5,7,9], with σ = 3.4 × 10⁻⁵ Jy beam−1. The fluxes were obtained using the MUSTANG-2 bolometer of the Green Bank Telescope. The origin (0,0) of these maps is the same as in Fig. 8.
Current usage metrics show cumulative count of Article Views (full-text article views including HTML views, PDF and ePub downloads, according to the available data) and Abstracts Views on Vision4Press platform.
Data correspond to usage on the plateform after 2015. The current usage metrics is available 48-96 hours after online publication and is updated daily on week days.
Initial download of the metrics may take a while.