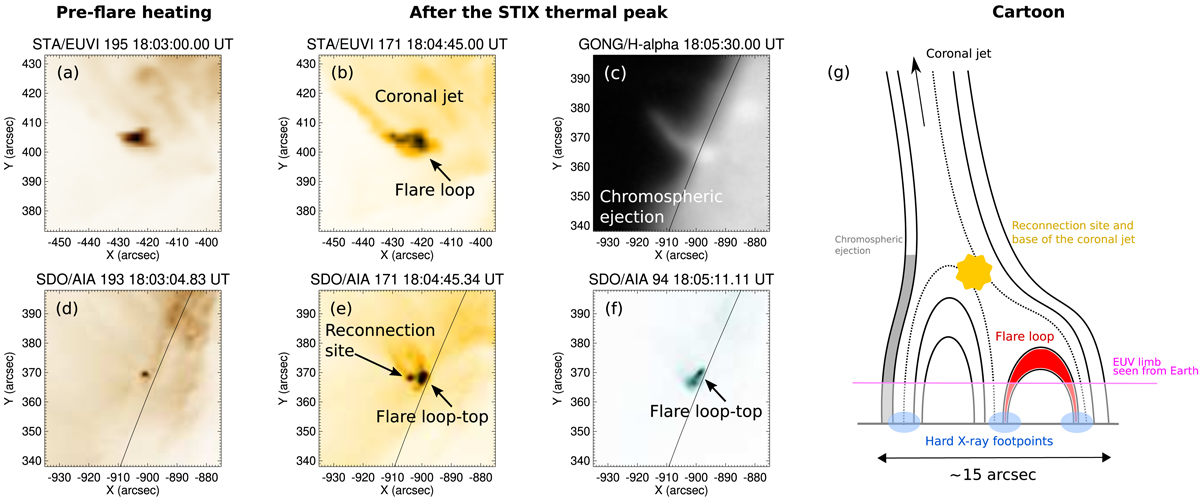
Fig. 6.
Download original image
Summary plot with observations and cartoon of the SOL2021-02-18T18:05 event. The leftmost column (panels (a) and (d)) shows the SDO/AIA 193 Å and STEREO-A/EUVI 195 Å maps during the pre-heating phase. The second and third columns (panels (b), (c), (e), and (f)) show, respectively, STEREO-A/EUVI 171 Å, GONG/Hα, SDO/AIA 171 Å, and 94 Å maps after the STIX thermal peak. The drawing in the rightmost panel depicts the cartoon of the interchange reconnection based on the emerging flux model in the case of the observed event.
Current usage metrics show cumulative count of Article Views (full-text article views including HTML views, PDF and ePub downloads, according to the available data) and Abstracts Views on Vision4Press platform.
Data correspond to usage on the plateform after 2015. The current usage metrics is available 48-96 hours after online publication and is updated daily on week days.
Initial download of the metrics may take a while.