Fig. 4.
Download original image
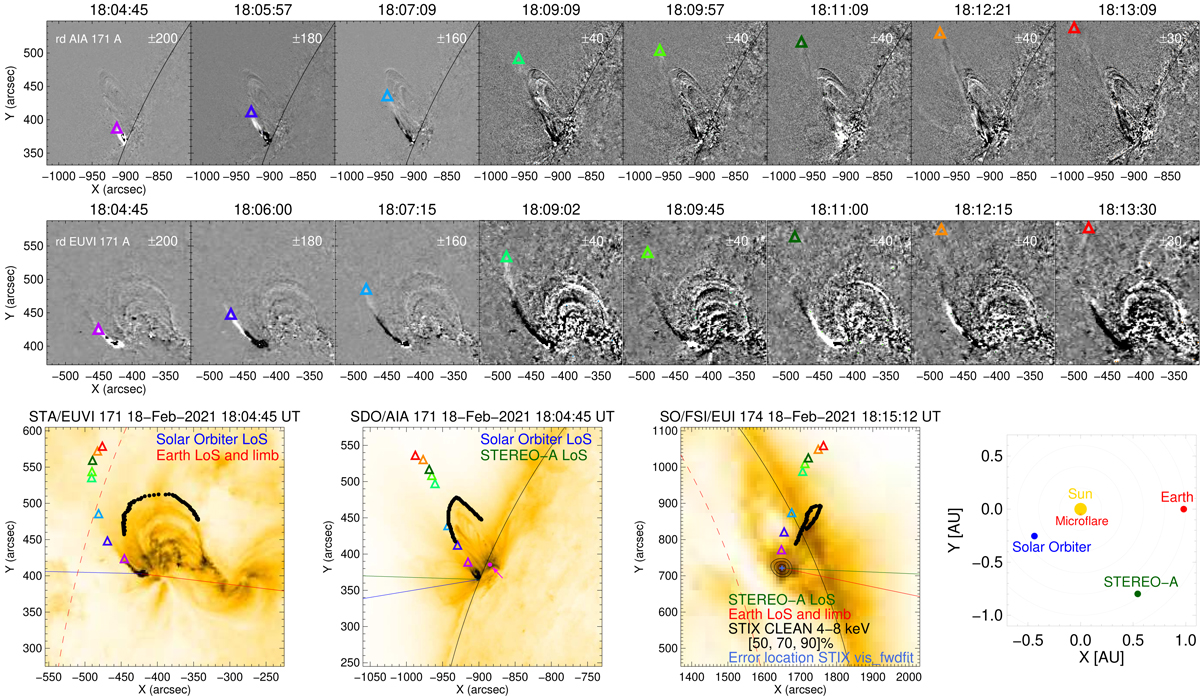
3D reconstruction of the propagating coronal jet. The top and middle row show the running difference maps of the SDO/AIA 171 Å and the STEREO-A/EUVI 171 Å maps, respectively. The colored triangles indicate the same features seen from the two look directions for different times. The bottom row includes three EUV maps and one insert: from left to right, respectively, the maps of STEREO-A/EUVI 171 Å, SDO/AIA 171 Å and Solar Orbiter/EUI 174 Å, and a scheme depicting the locations of the three spacecrafts. On top of the EUV images, the same colored triangles indicate the trajectory of the coronal jet and the black dots represent the reconstruction of the top part of the overarching loop. The solid lines represent the different line of sights (LoS) as seen from each individual vantage point. The black contours on top of the EUI map show the STIX thermal image. The magenta dot pointed by the arrow on top of the SDO/AIA map indicates the location of the remote enhancement.
Current usage metrics show cumulative count of Article Views (full-text article views including HTML views, PDF and ePub downloads, according to the available data) and Abstracts Views on Vision4Press platform.
Data correspond to usage on the plateform after 2015. The current usage metrics is available 48-96 hours after online publication and is updated daily on week days.
Initial download of the metrics may take a while.