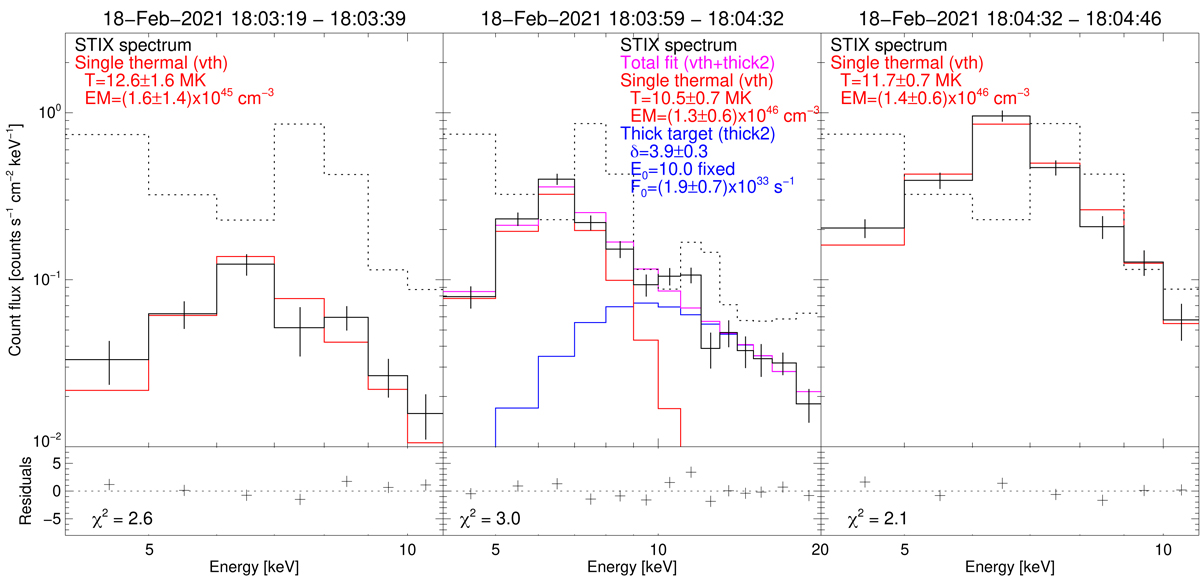
Fig. 3.
Download original image
Solar Orbiter/STIX background-subtracted count spectra (solid black) at different times during the flare. The STIX spectrum during the pre-flare phase (left) can be fitted by assuming an isothermal model (red). Around the STIX nonthermal peak (center), the spectrum can be fitted with an isothermal and a thick target model (blue), whereas around the thermal peak (right), we assumed an isothermal model only. The dashed black curves in each plot represent the STIX background spectra taken during non-flaring times close to the event. Below each plot we report the residuals, observations minus total fit, in units of the standard deviation calculated from counting statistics. The resulting fit parameters are shown in the legend of each plot.
Current usage metrics show cumulative count of Article Views (full-text article views including HTML views, PDF and ePub downloads, according to the available data) and Abstracts Views on Vision4Press platform.
Data correspond to usage on the plateform after 2015. The current usage metrics is available 48-96 hours after online publication and is updated daily on week days.
Initial download of the metrics may take a while.