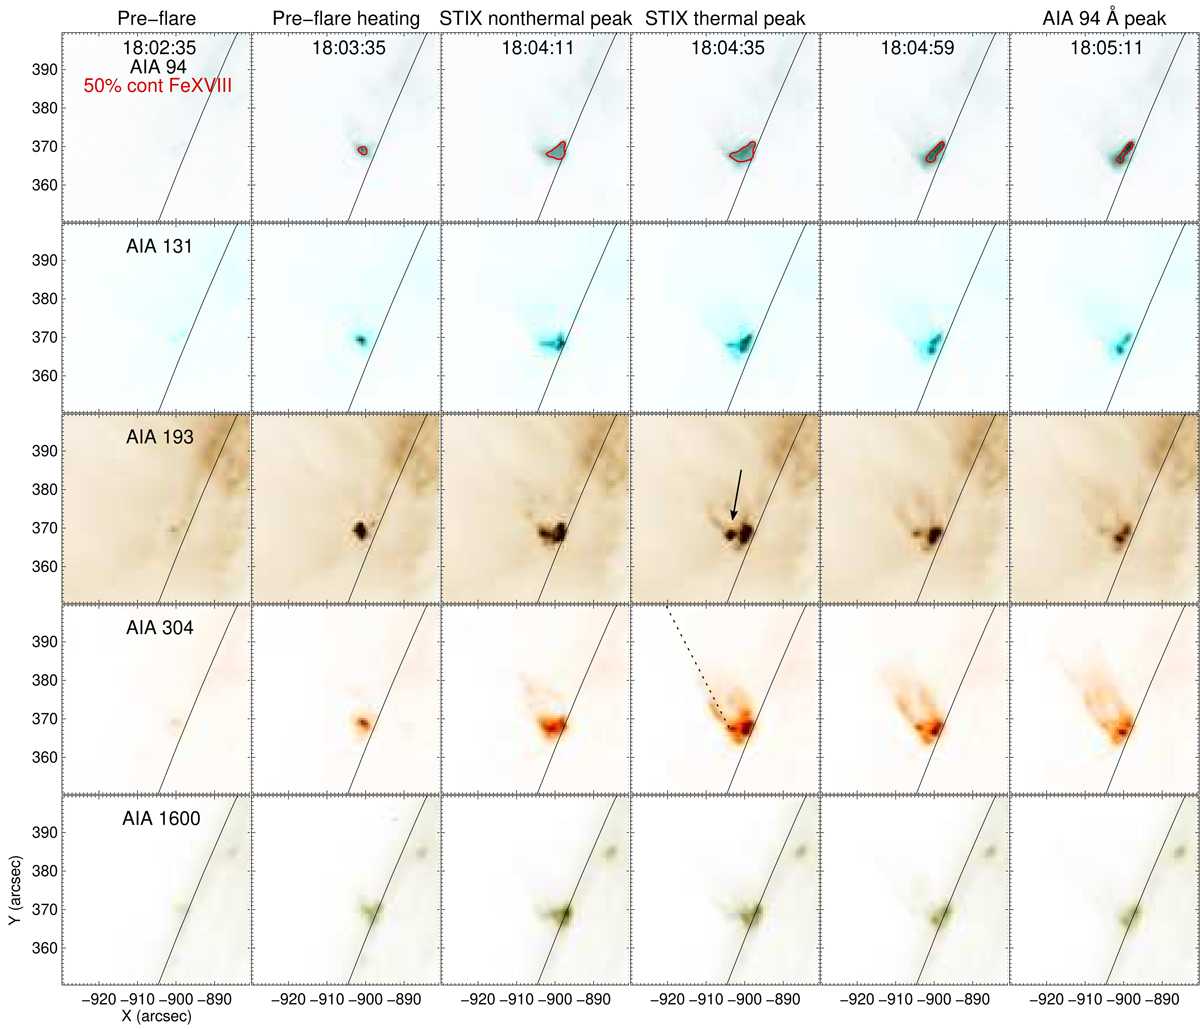
Fig. 2.
Download original image
SDO/AIA image sequences at different wavelengths for the SOL2021-02-18T18:05 event. From top to bottom: AIA 94 Å maps with in red the 50% contour of the Fe XVIII line complex maps (Del Zanna 2013), AIA 131 Å, AIA 193 Å, AIA 304 Å and AIA 1600 Å. The black dashed segment in the AIA 304 Å map represents the line that has been used for constructing the distance-time plot in Fig. 1. The black arrow indicates the above-the-loop location coinciding with the base of the jet and the electron acceleration site.
Current usage metrics show cumulative count of Article Views (full-text article views including HTML views, PDF and ePub downloads, according to the available data) and Abstracts Views on Vision4Press platform.
Data correspond to usage on the plateform after 2015. The current usage metrics is available 48-96 hours after online publication and is updated daily on week days.
Initial download of the metrics may take a while.