Fig. 1.
Download original image
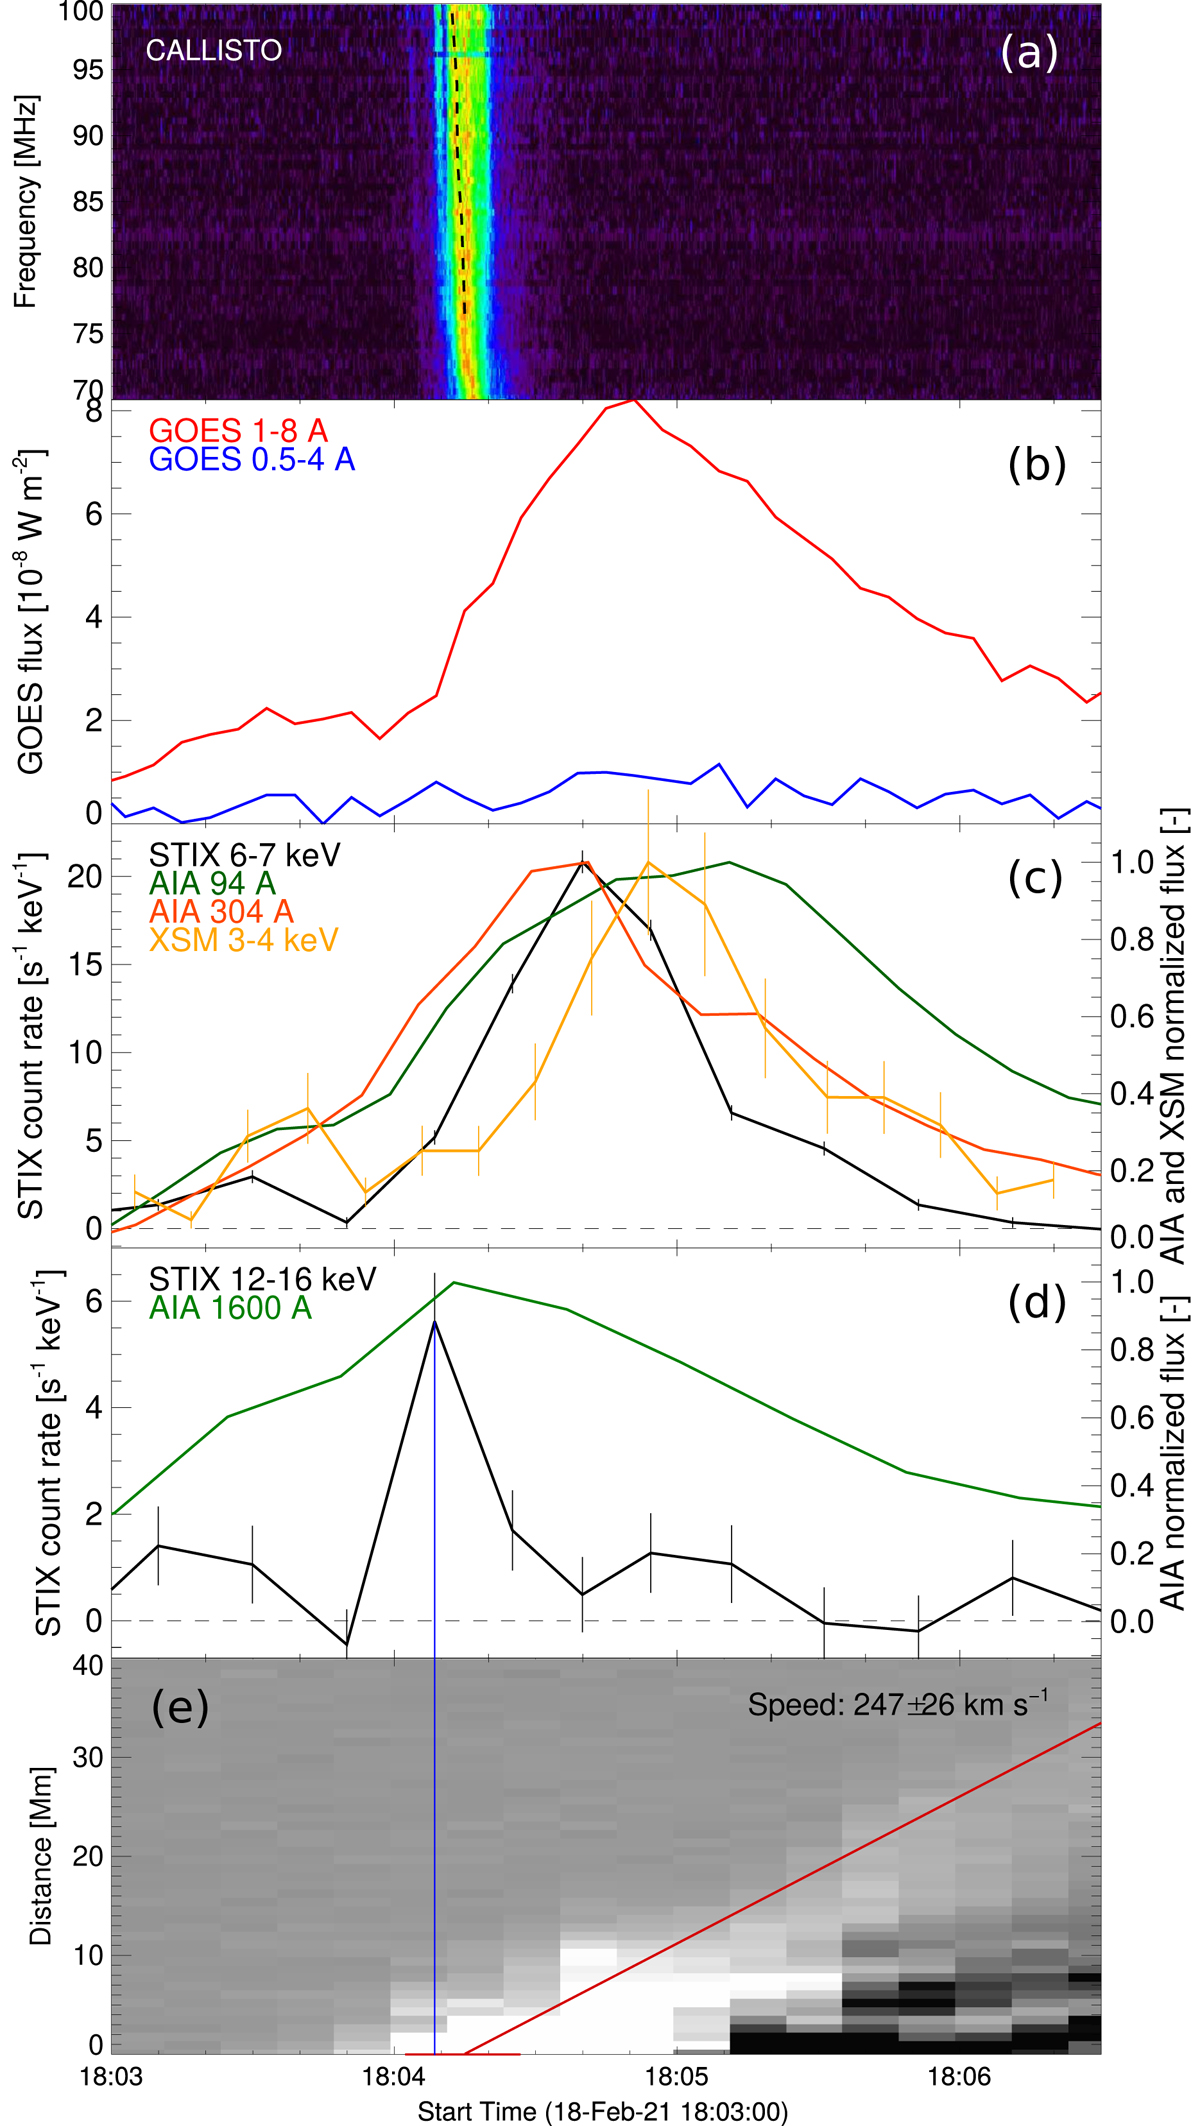
Time profiles of the event emissions at different wavelengths. Type III radio bursts observations of the CALLISTO station in Kangerlussuaq, Greenland, are given in panel (a), where the black dashed line represents the profile used to derive the drift rate. GOES/XRS temporal profiles are represented in panel (b). Panel (c) includes the light curves of the thermal emission observed by STIX (6–7 keV, black) and XSM (3–4 keV, orange), whereas in green and red the light curves of the AIA 94 Å and 304 Å, respectively. Panel (d) shows the nonthermal emission detected by STIX (12–16 keV, black) and the emission mostly coming from the chromosphere observable in the AIA 1600 Å band (light green). Finally, panel (e) represents the distance-time plot of the initial phase of the jet obtained from the running difference of the AIA 304 Å maps. The red line indicates the peak emission of the outward moving jet, corresponding to a speed in the plane-of-sky of 247 ± 26 km s−1. The vertical blue line, which indicates the peak time of the STIX nonthermal emission, nicely correlates with the origin of the jet that is indicated by the horizontal red segment at y = 0.
Current usage metrics show cumulative count of Article Views (full-text article views including HTML views, PDF and ePub downloads, according to the available data) and Abstracts Views on Vision4Press platform.
Data correspond to usage on the plateform after 2015. The current usage metrics is available 48-96 hours after online publication and is updated daily on week days.
Initial download of the metrics may take a while.