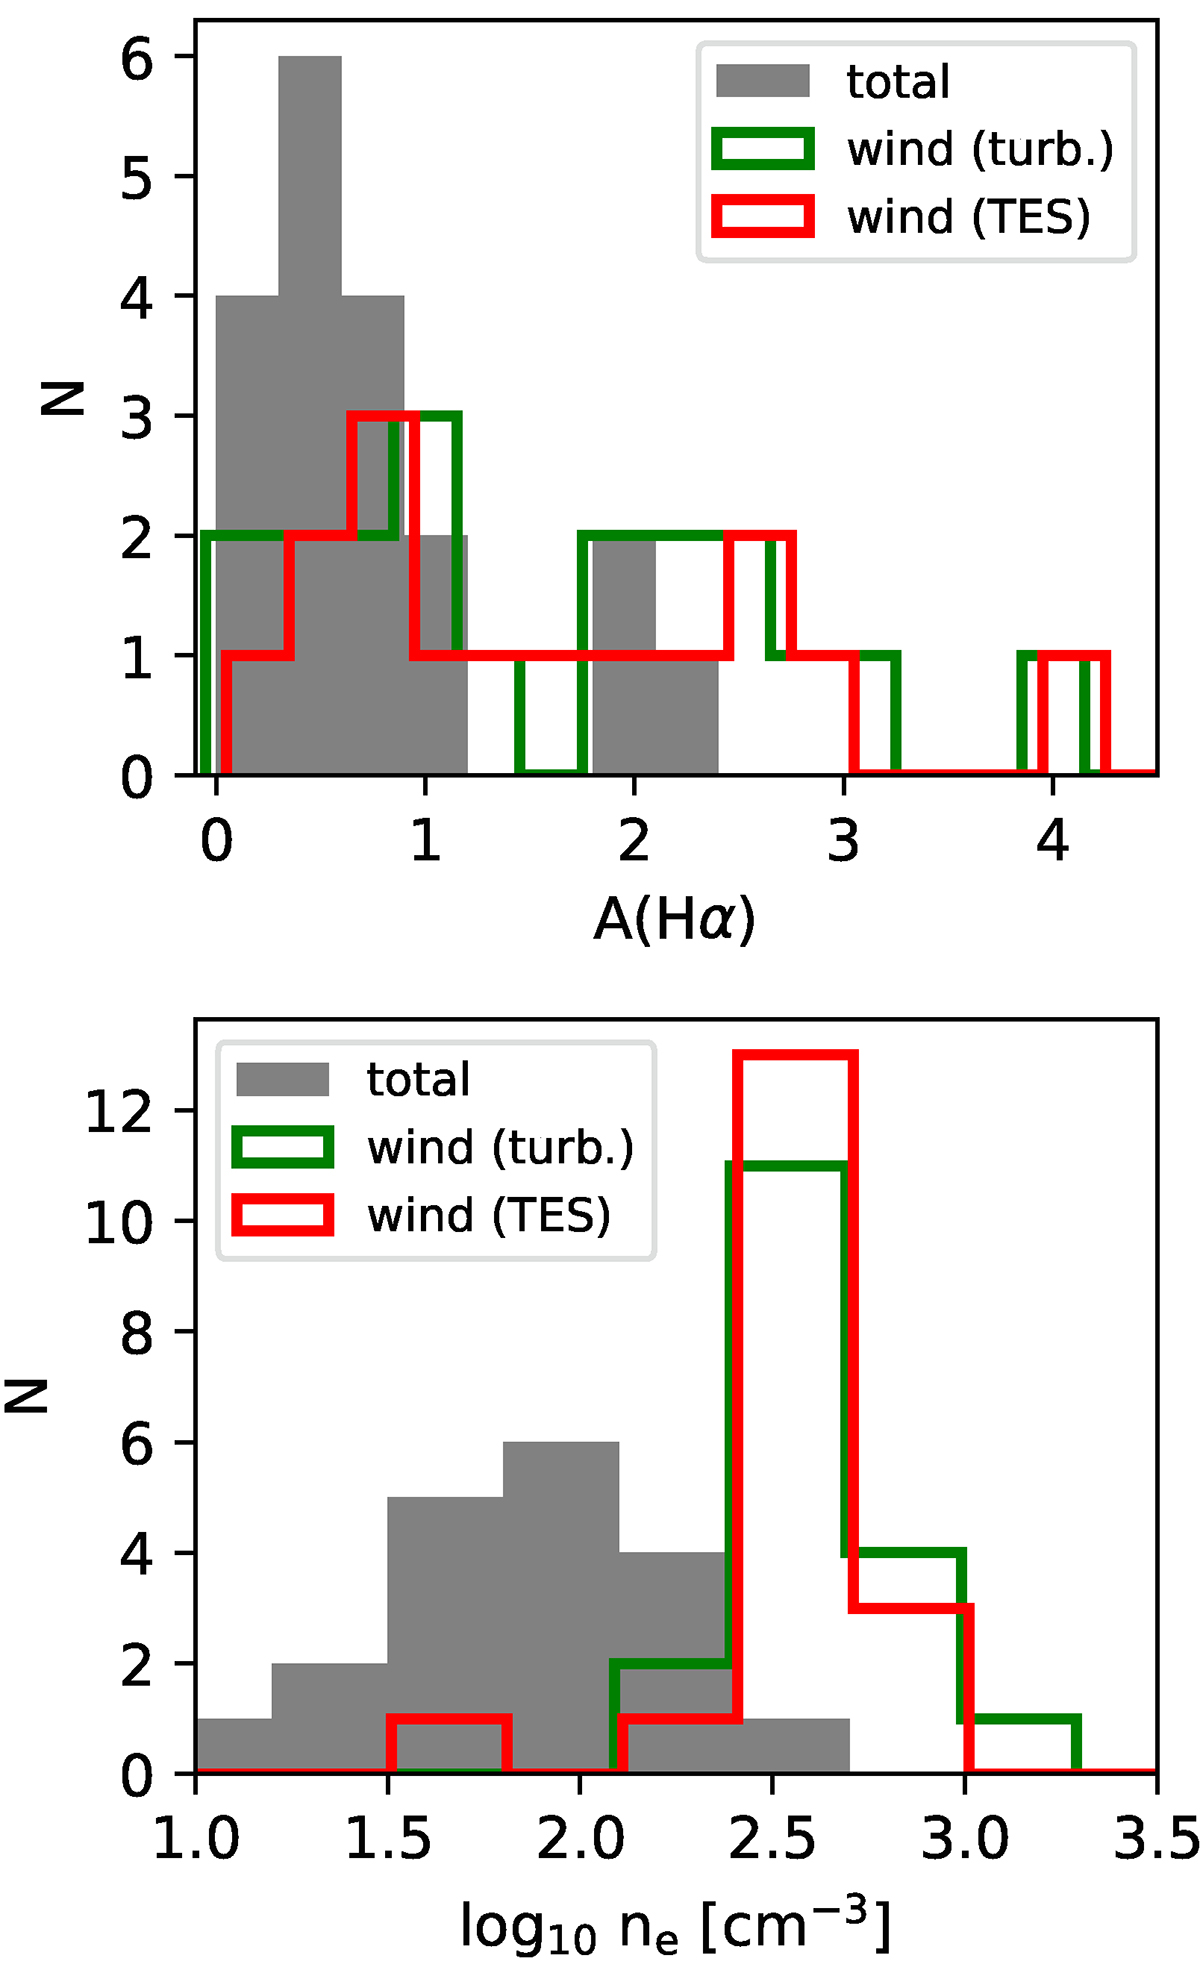
Fig. 7.
Download original image
Extinction A(Hα) (top panel) and electron density ne (bottom panel) distribution in our sample. The grey-shaded histograms show mean values representative for the whole galaxy. The solid green and red lines refer to the wind component computed in the turbulence and TES scenarios, respectively. Winds are characterised by higher A(Hα) and ne than in the rest of the galaxy.
Current usage metrics show cumulative count of Article Views (full-text article views including HTML views, PDF and ePub downloads, according to the available data) and Abstracts Views on Vision4Press platform.
Data correspond to usage on the plateform after 2015. The current usage metrics is available 48-96 hours after online publication and is updated daily on week days.
Initial download of the metrics may take a while.