Fig. 2.
Download original image
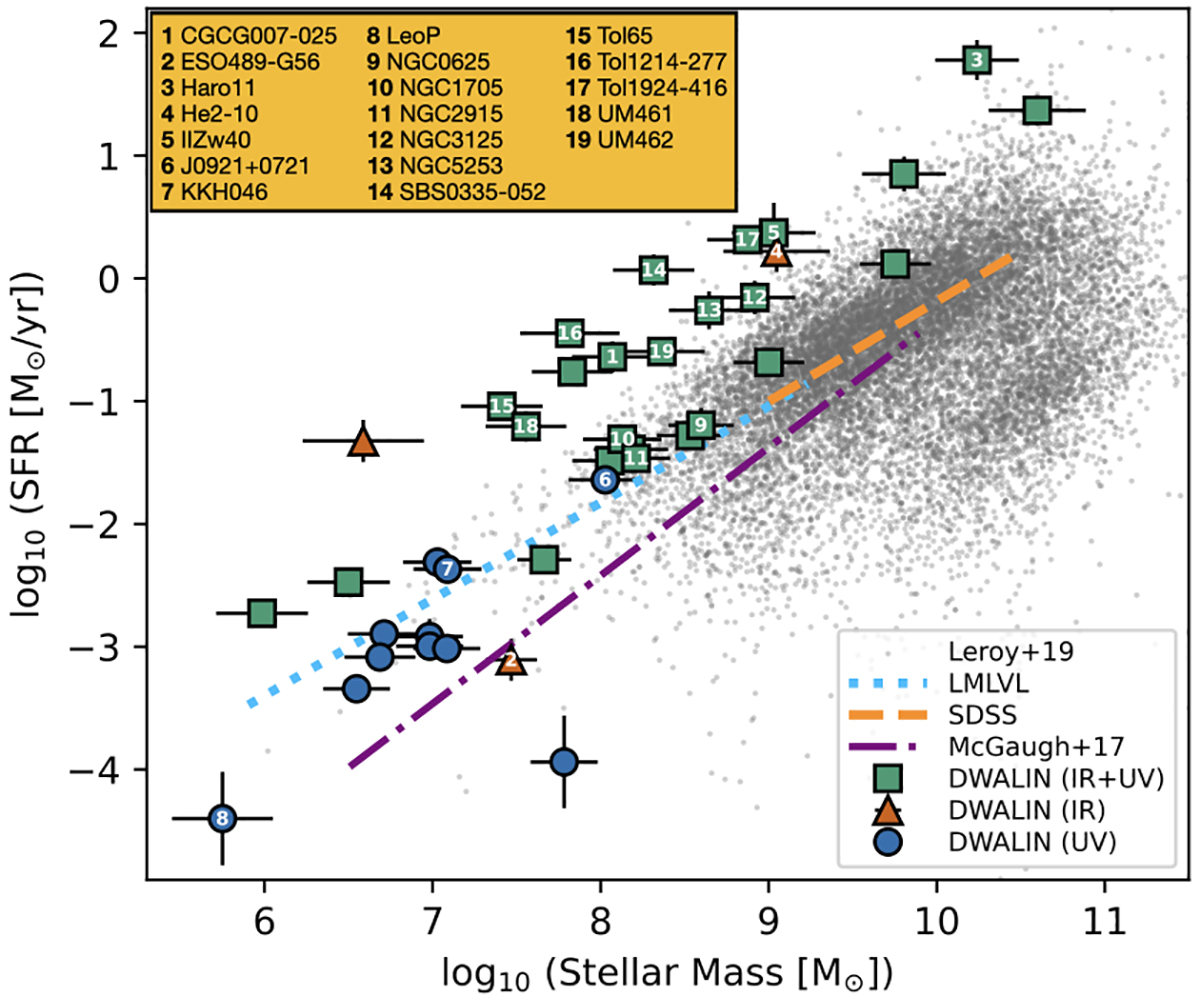
SFR vs. M⋆ plot for the DWALIN galaxy sample. Green squares, brown triangles, and blue circles indicate galaxies whose SFR measurements come from the combination of UV and MIR data, MIR data alone, or UV data alone, respectively (see text for details). ID numbers are shown for the DWALIN-19 sample studied with MUSE in this work. Gray dots show the sample of ≈15 750 nearby galaxies studied by Leroy et al. (2019). We also show the SFR–M⋆ trends at z ≃ 0 from the SDSS (Chang et al. 2015, dashed line), from the LMLVL sample (Berg et al. 2012, dotted line), and the relation derived by McGaugh et al. (2017) for a sample of low-surface brightness galaxies (dot-dashed line).
Current usage metrics show cumulative count of Article Views (full-text article views including HTML views, PDF and ePub downloads, according to the available data) and Abstracts Views on Vision4Press platform.
Data correspond to usage on the plateform after 2015. The current usage metrics is available 48-96 hours after online publication and is updated daily on week days.
Initial download of the metrics may take a while.