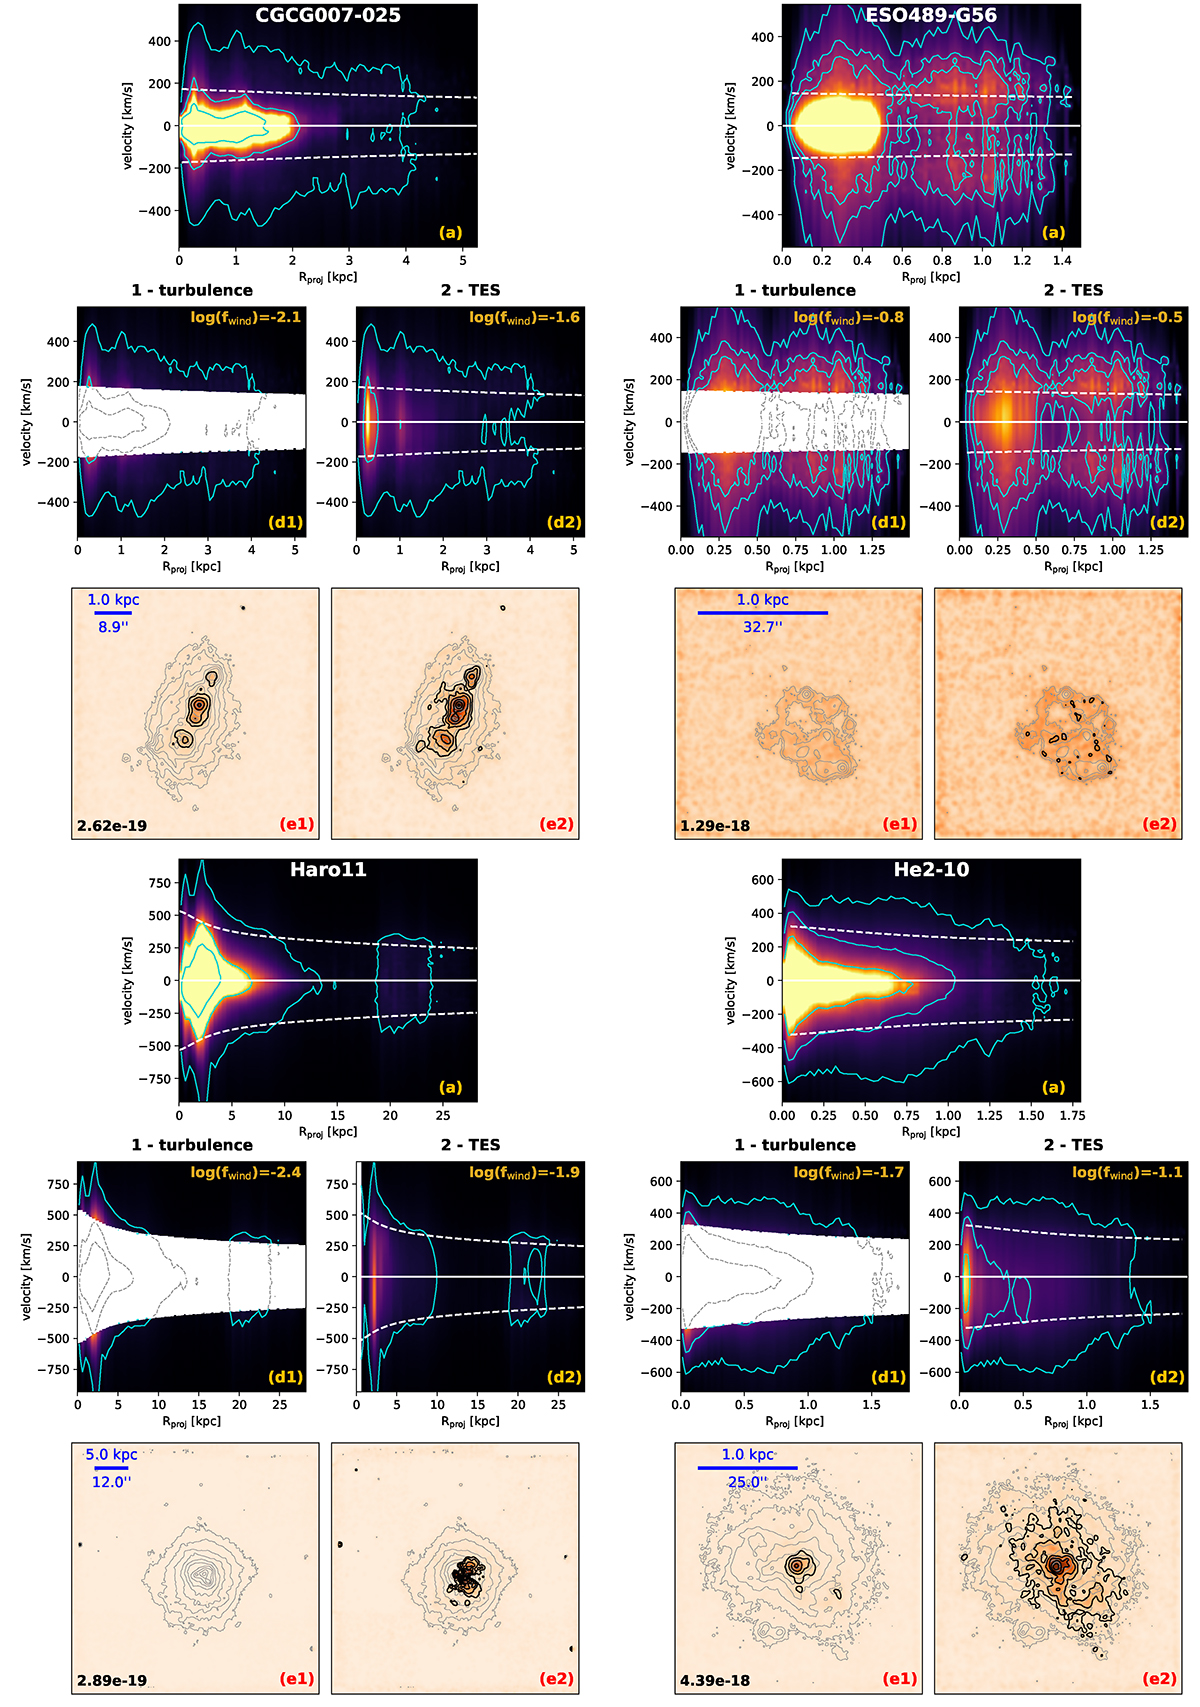
Fig. B.1.

Download original image
Extraction of the wind component from the Hα line in four galaxies of the DWALIN-19 sample. The individual panels are analogous to those shown in Fig. 6, with the galaxy name indicated on top of panel (a). To improve their visualisation, the intensity maps have been smoothed to a resolution (FWHM) of ∼1.5″. Iso-intensity contours in panels (e1) and (e2) are spaced by a factor of three, with the outermost being at an intensity level indicated in the bottom-left corner of panel (e1) (in units of erg s−1 cm−2, corresponding to 4σnoise), both for the whole emission (grey contours) and for the wind component alone (black contours). No contours are shown when fluxes are below such value.
Current usage metrics show cumulative count of Article Views (full-text article views including HTML views, PDF and ePub downloads, according to the available data) and Abstracts Views on Vision4Press platform.
Data correspond to usage on the plateform after 2015. The current usage metrics is available 48-96 hours after online publication and is updated daily on week days.
Initial download of the metrics may take a while.


