Fig. 8
Download original image
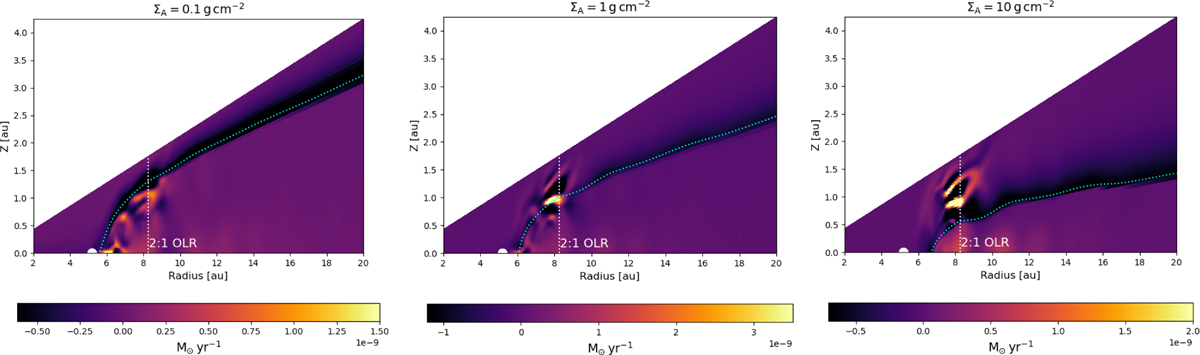
Contour plots showing time-averaged and azimuthally-integrated radial mass flux distributions in the various layered disc models with embedded planets. The cyan dotted line indicates the location where the column density measured from the disc surface corresponds to ΣA. The vertical white dotted line denotes the location of the 2:1 outer Lindblad resonance. Note that only the upper hemisphere of the disc is simulated.
Current usage metrics show cumulative count of Article Views (full-text article views including HTML views, PDF and ePub downloads, according to the available data) and Abstracts Views on Vision4Press platform.
Data correspond to usage on the plateform after 2015. The current usage metrics is available 48-96 hours after online publication and is updated daily on week days.
Initial download of the metrics may take a while.