Fig. 7
Download original image
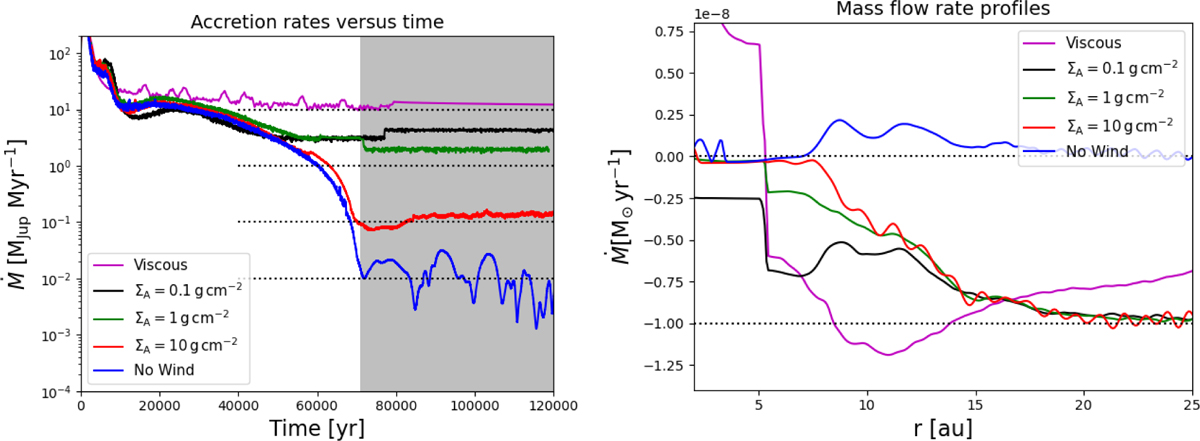
Gas accretion and radial mass flow rates. Left panel: gas accretion rates onto the planets versus time for all disc models. Moving from top to bottom, the horizontal black dotted lines correspond to accretion rates of 10, 1, 0.1, and 0.01 MJup Myr−1. The grey shaded region highlights the temporal domain within which the value of K in Eq. (4) is increased from 6 to 30. For the Viscous run and those with different values of ΣA, the increase coincides with the discontinuous changes to the accretion rates that can be observed. The value of K for the No Wind case was increased at time ~87 000 yr. Right panel: radial mass flux profiles for all disc models containing Jovian mass planets. The upper and lower horizontal black dotted lines correspond to radial mass fluxes of 0 and 10−8 M⊙ yr−1, respectively. The mass fluxes were computed at the times corresponding to the surface density profiles displayed in Fig. 6.
Current usage metrics show cumulative count of Article Views (full-text article views including HTML views, PDF and ePub downloads, according to the available data) and Abstracts Views on Vision4Press platform.
Data correspond to usage on the plateform after 2015. The current usage metrics is available 48-96 hours after online publication and is updated daily on week days.
Initial download of the metrics may take a while.