Fig. 6
Download original image
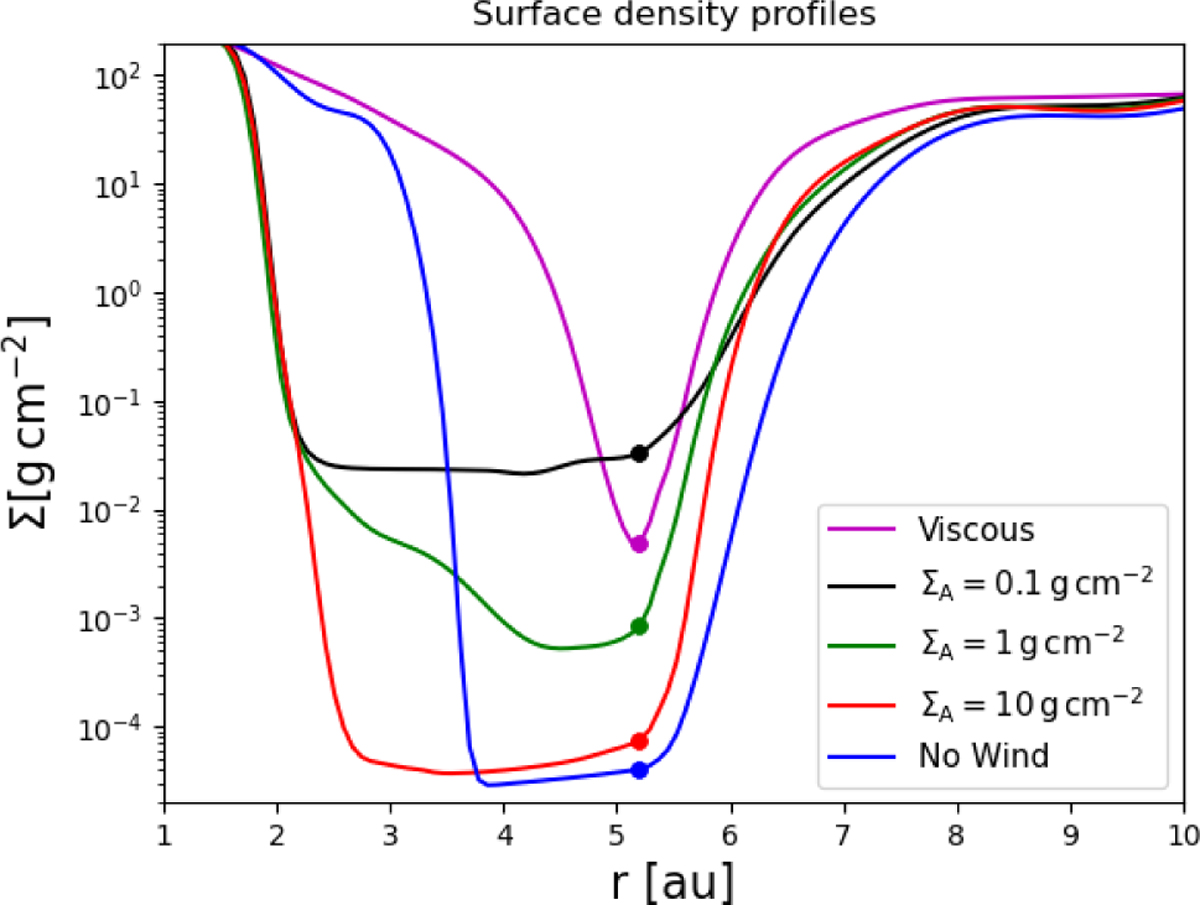
Azimuthally averaged surface density profiles from all disc models computed once each run had evolved for ~49 000 yr after the value of K was increased from 6 to 30 in Eq. (4). The planet positions are indicated by the filled circles. Note that the inner boundary condition influences the surface density profiles close to the inner boundary. The profiles shown for each run correspond to the right-hand-most midplane density contours shown in Fig. 5.
Current usage metrics show cumulative count of Article Views (full-text article views including HTML views, PDF and ePub downloads, according to the available data) and Abstracts Views on Vision4Press platform.
Data correspond to usage on the plateform after 2015. The current usage metrics is available 48-96 hours after online publication and is updated daily on week days.
Initial download of the metrics may take a while.