Fig. 9.
Download original image
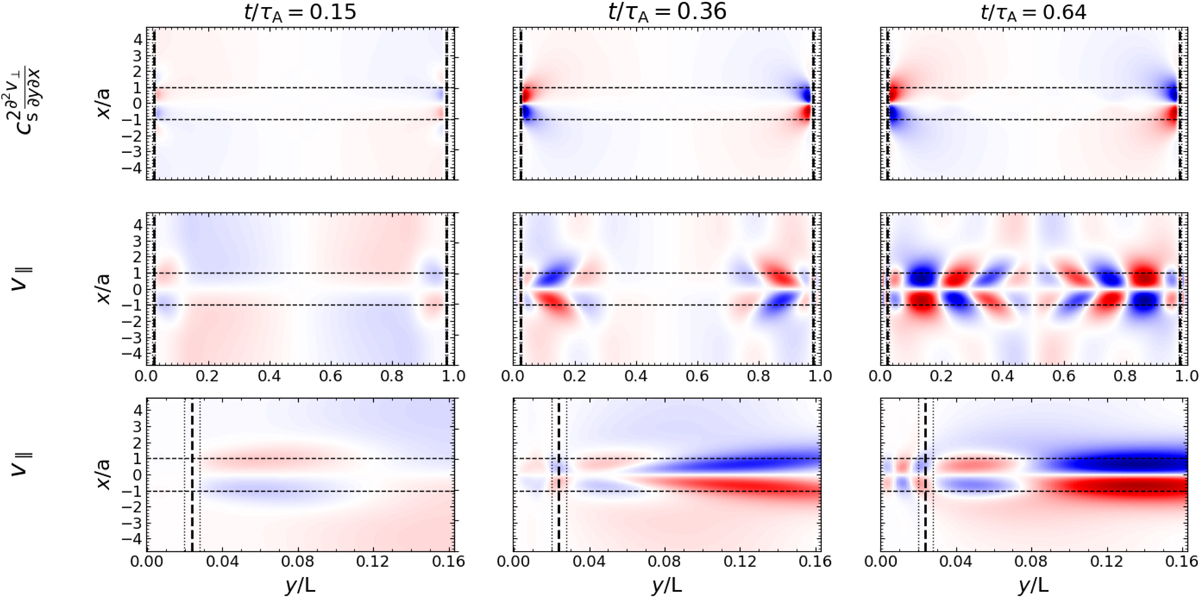
Evolution of the acoustic coupling. Top: temporal evolution of the coupling term ![]() across the entire loop. Middle: temporal evolution of the longitudinal velocity, vy. Bottom: temporal evolution of vy in a restricted domain near the left footpoint. The dashed line indicates the position of the transition region at y = y0, and the dotted-dashed line indicates the distance y0 ± Δy.
across the entire loop. Middle: temporal evolution of the longitudinal velocity, vy. Bottom: temporal evolution of vy in a restricted domain near the left footpoint. The dashed line indicates the position of the transition region at y = y0, and the dotted-dashed line indicates the distance y0 ± Δy.
Current usage metrics show cumulative count of Article Views (full-text article views including HTML views, PDF and ePub downloads, according to the available data) and Abstracts Views on Vision4Press platform.
Data correspond to usage on the plateform after 2015. The current usage metrics is available 48-96 hours after online publication and is updated daily on week days.
Initial download of the metrics may take a while.