Open Access
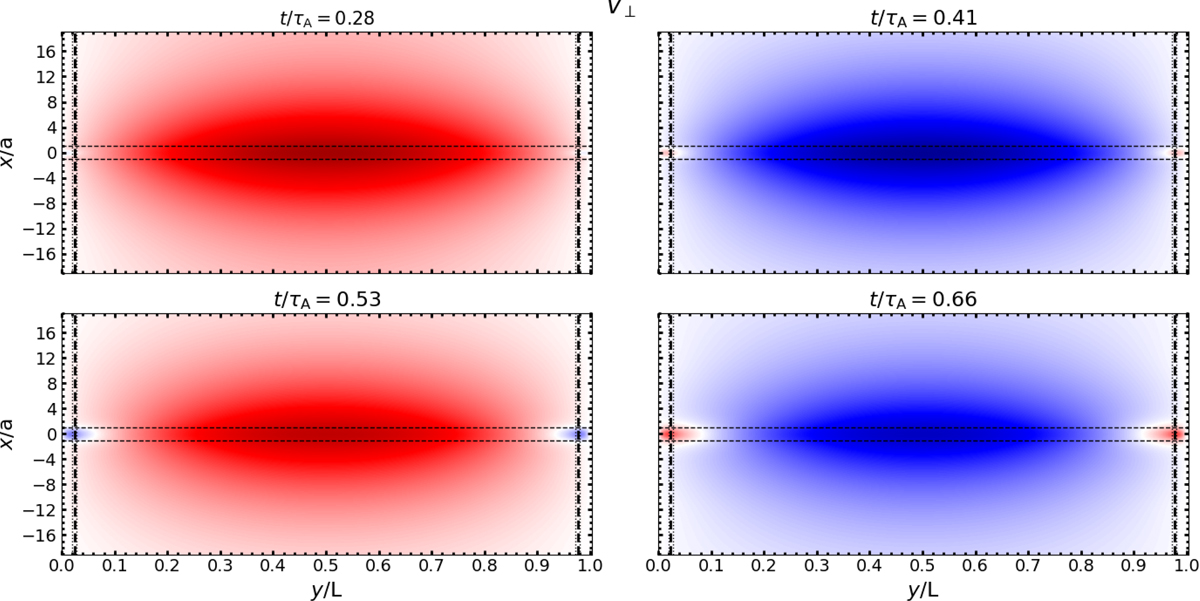
Fig. 7.
Download original image
Temporal evolution of the transverse oscillation for a simulation with plasma-β = 0.08 and an initial perturbation v0 = 0.001vAi. The thick dashed lines indicate the positions of the transition region at y0 from the photosphere. The thin dashed lines are at x = ±a Mm from the loop axis.
Current usage metrics show cumulative count of Article Views (full-text article views including HTML views, PDF and ePub downloads, according to the available data) and Abstracts Views on Vision4Press platform.
Data correspond to usage on the plateform after 2015. The current usage metrics is available 48-96 hours after online publication and is updated daily on week days.
Initial download of the metrics may take a while.