Open Access
Fig. 6.
Download original image
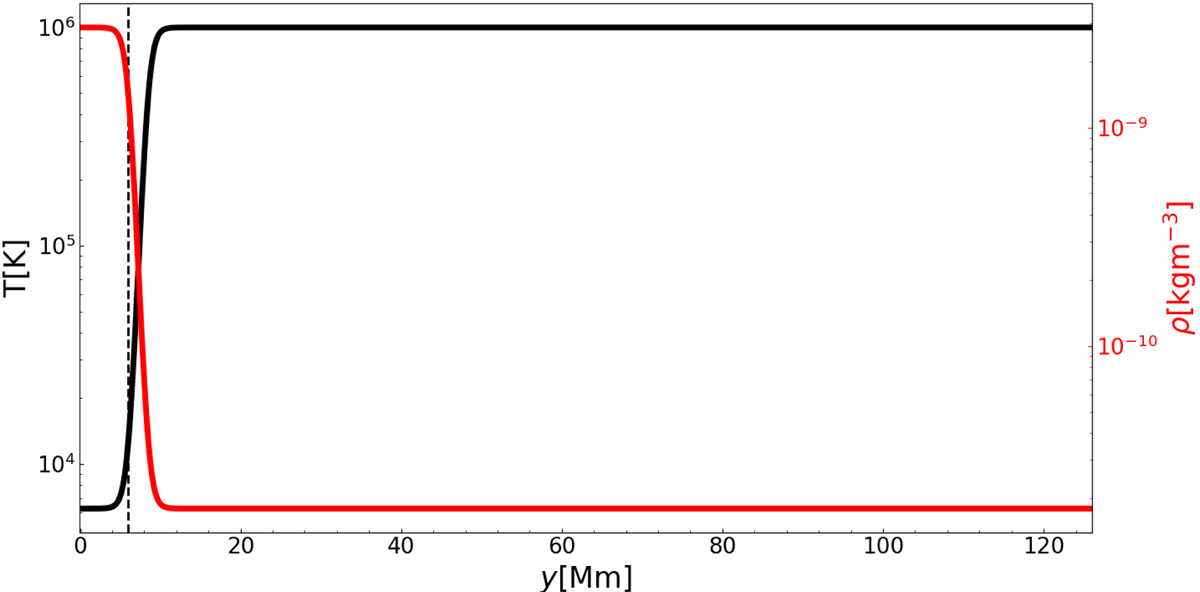
Equilibrium temperature and density profiles along the loop at x = x0, which are represented by the solid black and red lines, respectively. The dashed line indicates the positions at a distance y0 from the photosphere.
Current usage metrics show cumulative count of Article Views (full-text article views including HTML views, PDF and ePub downloads, according to the available data) and Abstracts Views on Vision4Press platform.
Data correspond to usage on the plateform after 2015. The current usage metrics is available 48-96 hours after online publication and is updated daily on week days.
Initial download of the metrics may take a while.