Fig. 5.
Download original image
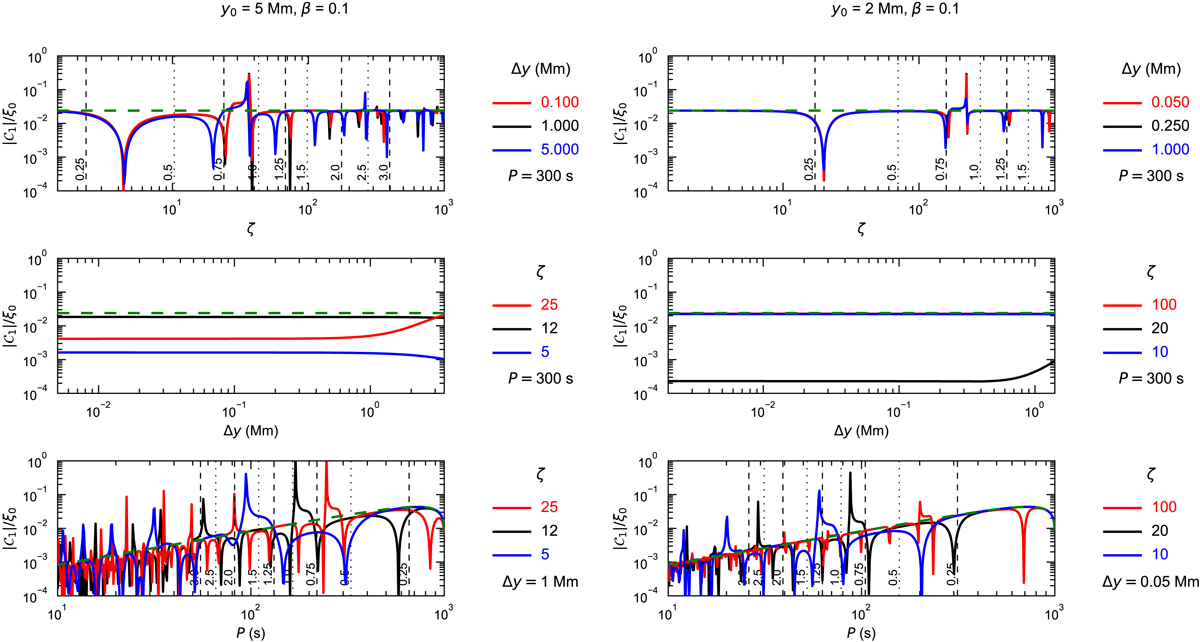
Displacement amplitudes of the acoustic wave propagating from the transition region into the corona, |𝒞1|, relative to the transverse loop displacement at the loop top, ξ0. Top panels: relative amplitude as a function of density contrast, ζ, for three values of transition region width, Δy, at a fixed period, P. Middle panels: relative amplitude as a function of Δy for three values of ζ at a fixed P. Bottom panels: relative amplitude as a function of P for three values of ζ at fixed Δy. The green dashed line shows the relative amplitude obtained from Eq. (24) from White & Verwichte (2021) for a fully reflective boundary. Vertical dashed and dotted lines represent values where the travel time from the lower boundary to y0 are multiples of 4τS, ch/P, for the parameters of the black curve. The left and right sets of panels are for y0 = 5 Mm and y0 = 2Mm, respectively. Also, ![]() , which corresponds to a plasma-β = 0.1.
, which corresponds to a plasma-β = 0.1.
Current usage metrics show cumulative count of Article Views (full-text article views including HTML views, PDF and ePub downloads, according to the available data) and Abstracts Views on Vision4Press platform.
Data correspond to usage on the plateform after 2015. The current usage metrics is available 48-96 hours after online publication and is updated daily on week days.
Initial download of the metrics may take a while.