Open Access
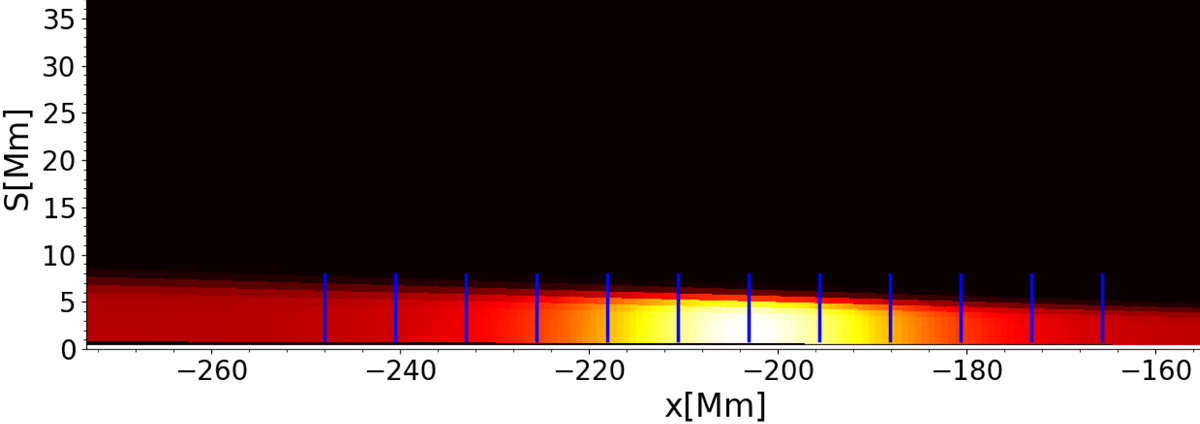
Fig. 16.
Download original image
Straight loop simulation mapped to a semi-circular grid. Only a single footpoint is shown. The intensity is the emission measure integrated along the LOS rays. Solid blue lines show LOS rays taken from the footpoint from a height s = 0 to 8 Mm.
Current usage metrics show cumulative count of Article Views (full-text article views including HTML views, PDF and ePub downloads, according to the available data) and Abstracts Views on Vision4Press platform.
Data correspond to usage on the plateform after 2015. The current usage metrics is available 48-96 hours after online publication and is updated daily on week days.
Initial download of the metrics may take a while.